• 产品
  • Evaluate our Software
  • 下载
  • Free Utilities
  • 购买
  • 芯片厂商
  • 支持
  • 关于我们
  • Search
  • 工作机会
  • 新闻简报
  • 联系我们
  • J-Link debug probes
  • Control Panel

    Control panel

    Gives full insight in real time of what J-Link is currently doing and can be used to extend the feature set of J-Link, without even touching the IDE. It is available on all models (even small J-Link OBs and models without Ethernet).

    Contact us
    Downloads
    Documentation
    SEGGER Debug & Trace Probes
    1. 1.Extending the IDE feature set
    2. 2.Information about J-Link and debug session
    3. 3.Configuring J-Link
    4. 4.Watching CPU registers
    5. 5.Monitoring target power consumption

    Overview

    The J-Link control panel extends the feature set of J-Link by giving the user full insight of what J-Link is currently doing. By the different tabs, it provides plenty of information about various things that make the debugging life easier and more transparent.

    The J-Link control panel is available as soon as the debug session has been started. It can be accessed by typing localhost:19080 into the address line of the web browser (all popular web browsers are supported). The J-Link control panel is available on all platforms (Windows, Linux, macOS).

    The J-Link control panel is based on SEGGER's emWeb web server which is available as a separate product.

    Extending the IDE feature set

    Who does not know it? An IDE has been chosen and working with it is started. Then, a new, very useful feature is introduced in the J-Link software but the IDE has not adapted it yet. Or even worse, the IDE cannot be updated due to certification reasons. The J-Link control panel provides the opportunity to make use of new J-Link features without even touching the IDE itself. As the J-Link control panel is not bound to the IDE in any way, updates can be provided independent from the IDE being used.

    Information about J-Link and debug session

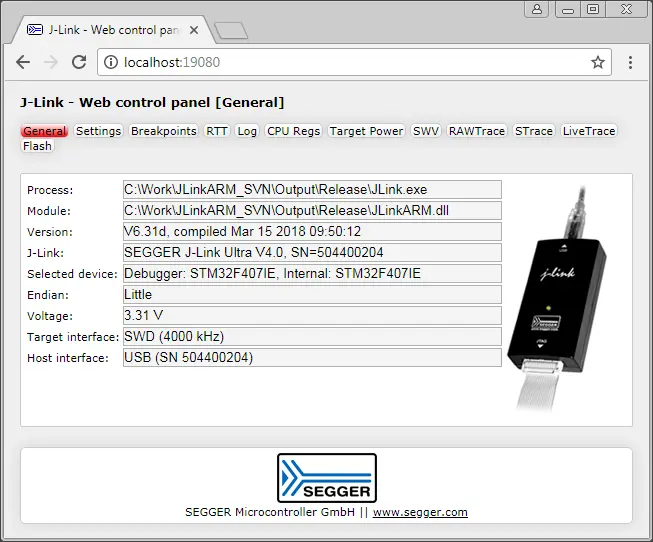
    The J-Link control panel provides information about the J-Link (model, S/N, host connection, interface speed, ...) as well as information about the debug session (what process has started the debug session, which version of the J-Link software has been loaded, ...)

    J-Link CP General

    Configuring J-Link

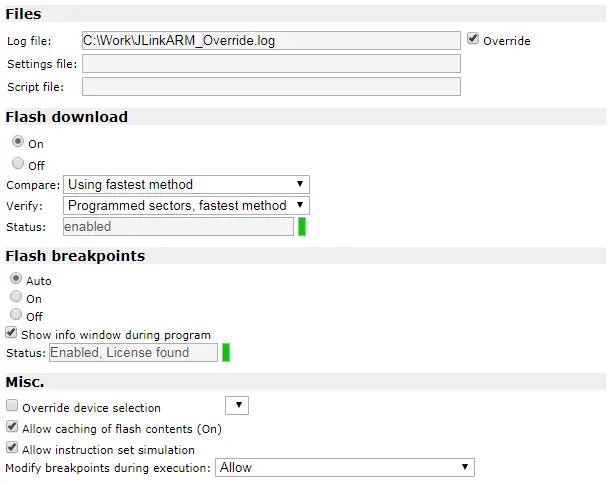
    The J-Link control panel allows easy configuration of J-Link, be it general configuration like enable/disable supply power to the target, or debug session specific configuration like enabling/disabling flash download, status dialogs etc.

    JLinkCP_Settings

    Watching CPU registers

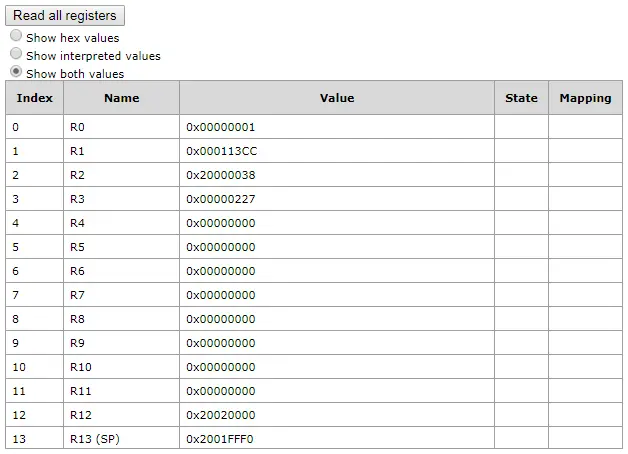
    The J-Link control panel provides a view to the current CPU register values. This may also include CPU registers that are not even available through the IDE that is currently used.

    JLinkCP_CPURegs

    Monitoring target power consumption

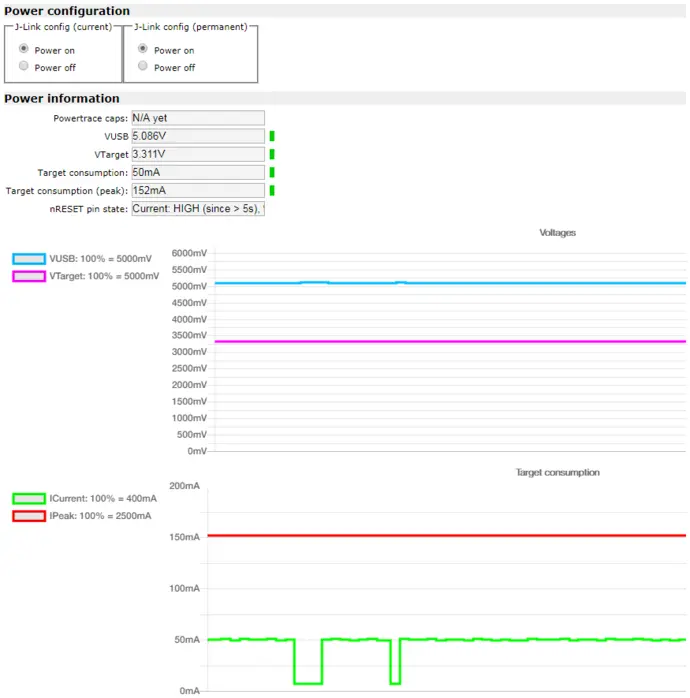
    The J-Link control panel gives information about the current power consumption (if J-Link supplies power to the target) of the target system that is debugged. This information is presented in a graph and updated live.

    Note: This feature is only available on high-end models like J-Link ULTRA+ and J-Link Pro. See Model comparison.
    JLinkCP_Power
    • Release notes
    • Update notification
    • Support
    • Silicon vendor resources
    • J-Link Prime

    全球总部

    德国: SEGGER Microcontroller GmbH

    地址: Ecolab-Allee 5
    40789 Monheim am Rhein, Germany
    电邮: info@segger.com
    电话: +49-2173-99312-0
    传真: +49-2173-99312-28

    网点分布

    中国:哲戈微系统科技(上海)有限公司

    地址: 中国上海市闵行区秀涟路133号
    大虹桥国际A 栋218室
    邮编201199
    电邮: china@segger.com
    电话: +86-133-619-907-60


    简易信息聚合

    通过ISO 9001认证

    ISO 9001

    30多年的嵌入式行业经验

    First-class embedded software tools since 1992
    • 版本说明
    • 免责声明
    • 行为准则
    • 隐私策略
    • 沪ICP备2022005181号
    • 沪公网安备 31011202014525号
    © 2025 SEGGER - 版权所有.

    您即将离开 segger.cn 而访问境外网站,是否继续?