With the J-Trace PRO streaming trace capabilities, Ozone analyzes trace data in real-time, while the data is transferred from the target system to the host computer. The analyzed data contains information about which instructions have been executed on the target, whether conditional instructions have taken both paths, and how often each instruction has been executed. With the captured trace data, Ozone analyzes your application to construct a code profile and identify "hot spots" for potential optimization.
Ozone analyzes and displays the Run Count and CPU Load of modules and functions while the system executes.
What is Code Profiling?
Code profiling measures execution time and frequency of functions, blocks and instructions. The metrics characterize an execution system and highlight where computing time is spent. This makes it easy to find potential for optimization: Code that is executed frequently and/or places a high load on the system.
Identifying "hot spots" can be crucial. Reducing the execution time of frequently used functions by just a single CPU cycle can have higher impact on the system than reducing a rarely used function by a thousand CPU cycles.
Live Code Profiling with Ozone
With J-Trace PRO streaming trace it is possible to get the most accurate code profiling information. Tests can be done without any source modification and even on production code.
Ozone updates code profiling data in real time, while the target is running. It maps the execution counts to the high-level source code and show the number of execution for each function, block, or source line. This enables identification of time-consuming or frequently called routines which may help to selectively optimize the system.
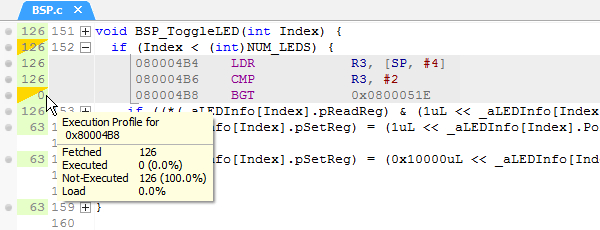
Ozone displays and updates the execution counters per line and instruction live.
A mouse-over tooltip provides more information about conditional execution.
Code Profiling Reports
After running all tests and measuring performance, the information can be used to improve the system. Ozone can export the data for further analysis.