An overview of debugging
Ozone offers well-known debug controls and information windows, such as source viewer, disassembly, variable/symbol windows, register view, and memory window.
Working with Ozone means developers have full access to a range of well-known debugging features. Furthermore, static information including functions and compiled source files lists provide an overview of the debugged application. Full control over the system is added with Conditional Code Breakpoints and Data Breakpoints.
To learn more, read on.
Source Code View with Ozone
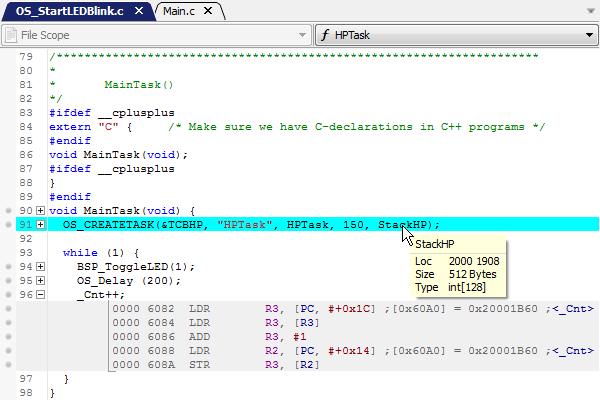
The Ozone Source Code Viewer provides an overview and enables navigation through the target application. Current program execution is shown by highlighting active source lines. This lets you set source code breakpoints to halt program execution. Additionally, you can modify program execution by letting it run from any location.
You can also learn more about the Source Code Viewer.
Disassembly Window: Explore Applications on Instruction Level
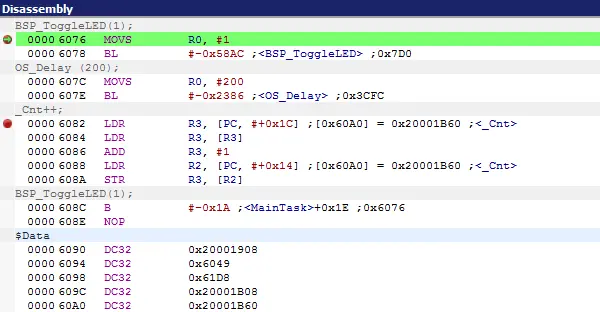
Ozone’s Disassembly Window lets you view the assembly code interpretation of the memory content. It is synchronized with the Source Viewer when stepping through the application. This allows you to follow program execution on the machine instruction level. You can learn more in Application Debugging.
Control Program Execution with Breakpoints
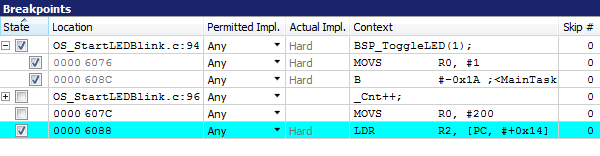
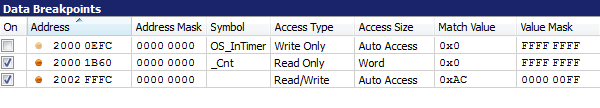
Breakpoints enable halting program execution at given locations or under given circumstances. Ozone’s advanced breakpoint features provide full control of such situations. Detailed information is displayed in the Breakpoints Window, as is the option to modify them. Discover more about the Breakpoint Window in Application Debugging.
Evaluate and Watch Variable Values
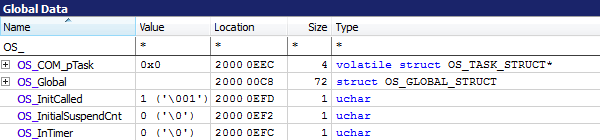
With Ozone’s symbol windows, you can watch and edit variables and expressions. The Watched Variables Window lets you select which symbols to show and which expressions to evaluate. The Local Data Windows shows symbols within the scope of the current execution point and function. The Global Data Window shows all global and file static symbols.
Learn more in Application Debugging.
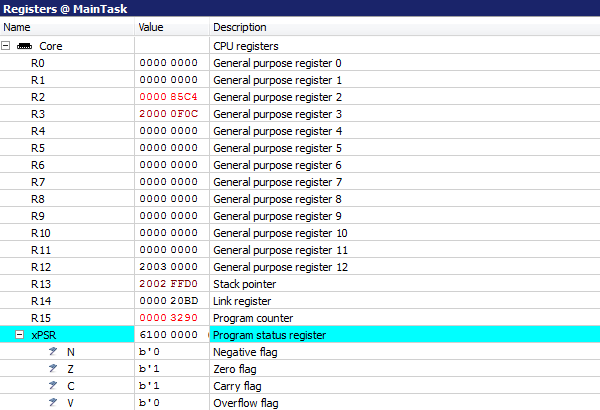
Check Register Contents
Ozone’s Register Window displays current CPU registers. These don’t just include basic CPU registers, but memory-mapped peripheral registers (SFRs) as well. Change-level highlighting enables easy identification of what the application is doing. Find out more in Application Debugging.
Communicate with the Target Application
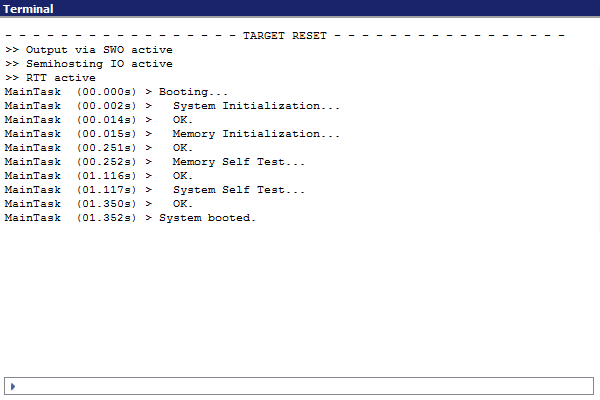
Ozone features printf-style terminal input and output from and to the target application. With support for various I/O mechanisms, Ozone provides maximum freedom and compatibility with any application. Find out more in Application Debugging.