Ozone essential debug features
A full-fledged multi-platform debugger and performance analyzer with features that go well beyond those of a typical debugger
Standard debug features
As a full-featured debugger, Ozone includes all of the common debug features that developers need and are familiar with. Features include code viewing, symbol and data windows, and register and memory displays. Ozone goes beyond typical debug use cases to enable efficient and extensive debugging within a fully integrated UI.
Source Code Viewer
The Source Code Viewer is the core of Ozone's graphical user interface. It enables navigation through firmware source code with syntax highlighting for C, C++, Assembly, and Rust. Users can jump to symbol declaration or into function definition and get an overview of a project's structure. The Source Code Viewer's header bar and Ozone's ability to find functions, global data, and source files take things a step further.
While debugging, users can quickly evaluate symbol values and expressions with mouse-over tool tips and Quick Watch. For longer observation, symbols can be dragged and dropped directly from the source code into the Watched Data window or the Data Sampling window.
Selective interleaving of source and disassembly code
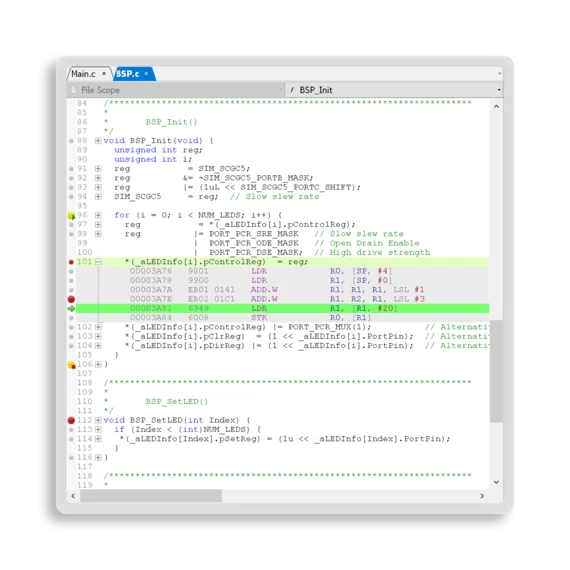
The Source Code Viewer's most valuable feature for embedded firmware development is its inline disassembly view. Users can expand every code line to reveal the instructions a compiler generated for the line.
In contrast to traditional disassembly views, the inline disassembly view immediately identifies all associated instructions, even when they are placed in non-contiguous blocks. With the inline disassembly view, users can check and verify code generated by a compiler.
Moreover, users can selectively step through complex expressions at the instruction level to trace exact behavior in critical situations.
Disassembly window
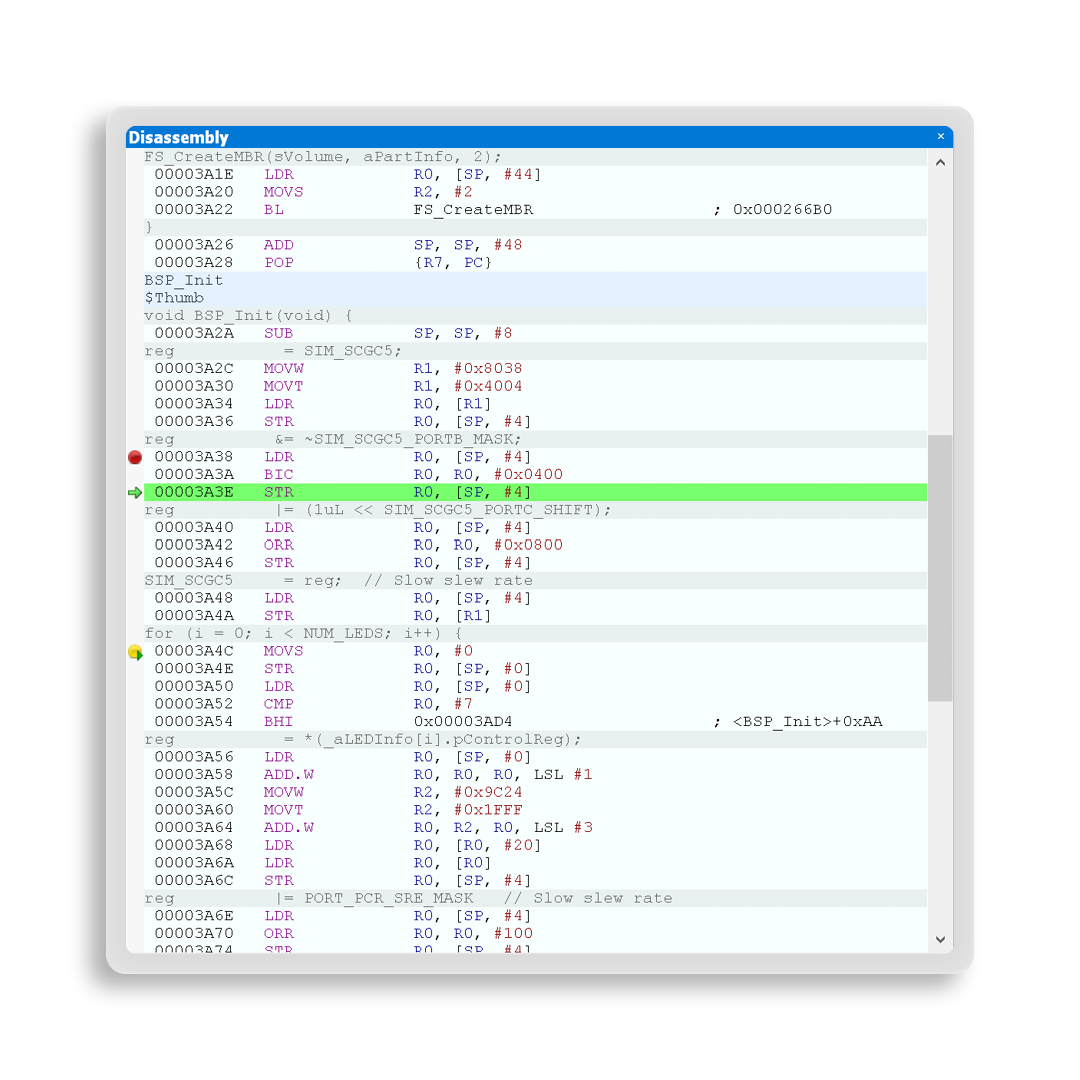
The Disassembly window displays firmware computer code at its lowest level. It analyzes the firmware's binary and target memory to show what the target hardware is going to execute. It displays each instruction, along with its address, machine code, and assembly code. The assembly code is enriched by commonly used, matching pseudo instructions; dereferenced offsets and their values; and referenced symbol values and jump targets.
The Disassembly window can display associated source code for instruction blocks inline, as well as labels, in order to identify functions and (read-only) data blocks. Ozone synchronizes the Disassembly window and the Source Code Viewer to automatically display the code currently being executed at the source and instruction levels. Users can jump from disassembly to corresponding source code and vice versa. Even when no source code is available, the Disassembly window provides information important for comprehending the firmware's code.
Some devices have custom instruction-set extensions. This is fairly common with RISC-V-based target devices. Ozone's disassembly view can be extended to display custom instructions.
Window synchronization
Ozone always puts the debug state into perspective, and with synchronized views, it provides a complete overview across all windows. During a halt, the Source Code Viewer and Disassembly window show the location of the currently executed code, inline with current symbol values and register contents in their respective windows.
When a user navigates through the call stack or the task list, these views are updated and provide full insight into what happened before or in parallel. The action of stepping back in time through the instruction trace is synchronized with the source code and timeline for easy high-level debugging of past events.
Change-level highlighting
Ozone assists users in quickly identifying changes in a system's state throughout a debug session. Each time a symbol, register contents, or data in memory changes, the corresponding value is highlighted.
In addition, Ozone features change-level highlighting. With every update cycle, highlighted unchanged values gradually change to indicate when the most recent change occurred. As a result, users can easily recognize how target states evolve from cycle to cycle — specifically in combination with a periodic refresh or looped break-and-continue cycles.
Observation of variable values
Along with insights into code, Ozone presents important information about variable values and a system's state. Data symbols can be analyzed in three windows that offer easy access to relevant information and that are highly flexible.
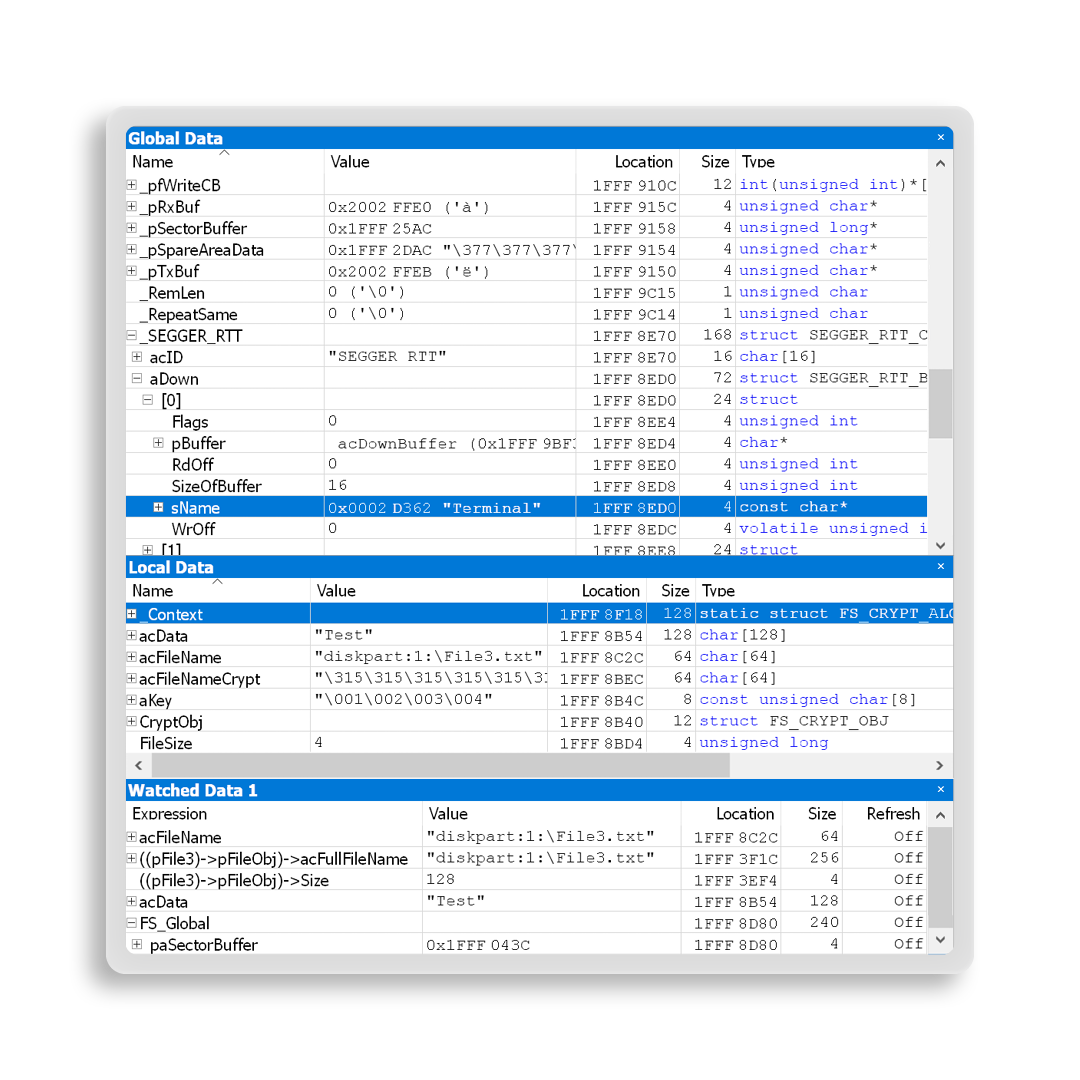
The Global Data window includes all global and static symbols that provide a full overview of data used by the system. The Local Data window adds local symbols that are present in a currently active function or code block. The Watched Data windows provide full flexibility for selectively viewing global data symbols, single members of a struct or array, and expressions.
All Data windows display information about symbol values in different formats, their location in memory or registers, and data size, as well as type and access information. All values are updated when the target state changes. In addition, the Watched Data windows feature a periodic refresh function that lets users monitor changing data while the target system is running.
Registers window
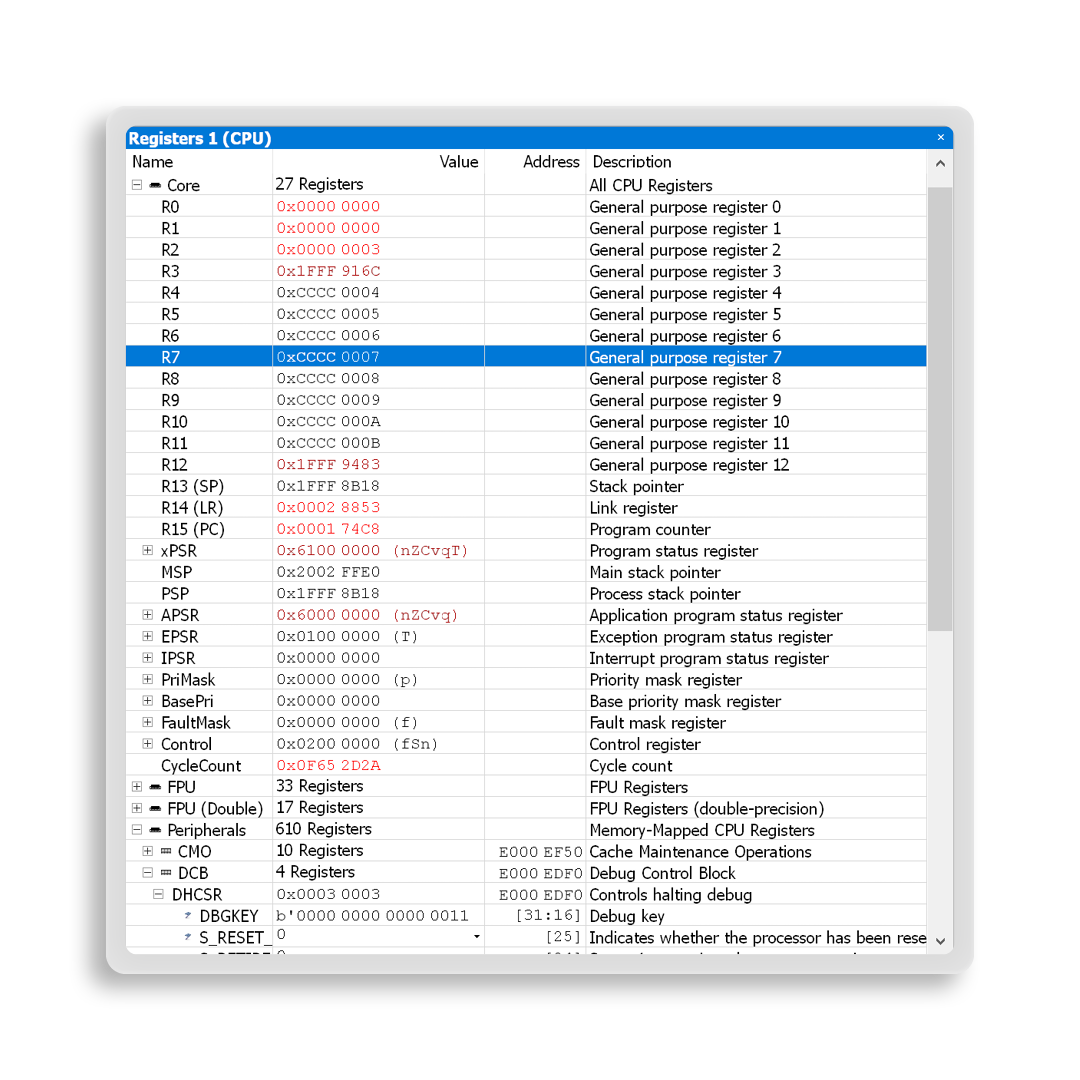
The Registers window enables closer analysis of the state and behavior of a CPU and its peripherals. Ozone displays CPU registers, including control and status registers and their fields, as well as co-processor registers. Additionally, Ozone can display memory-mapped peripheral registers (SFRs). The registers are organized in groups that can be selectively added and expanded. For full flexibility, Ozone features multiple instances of Register windows, which further help in organizing register groups and keeping important information in view.
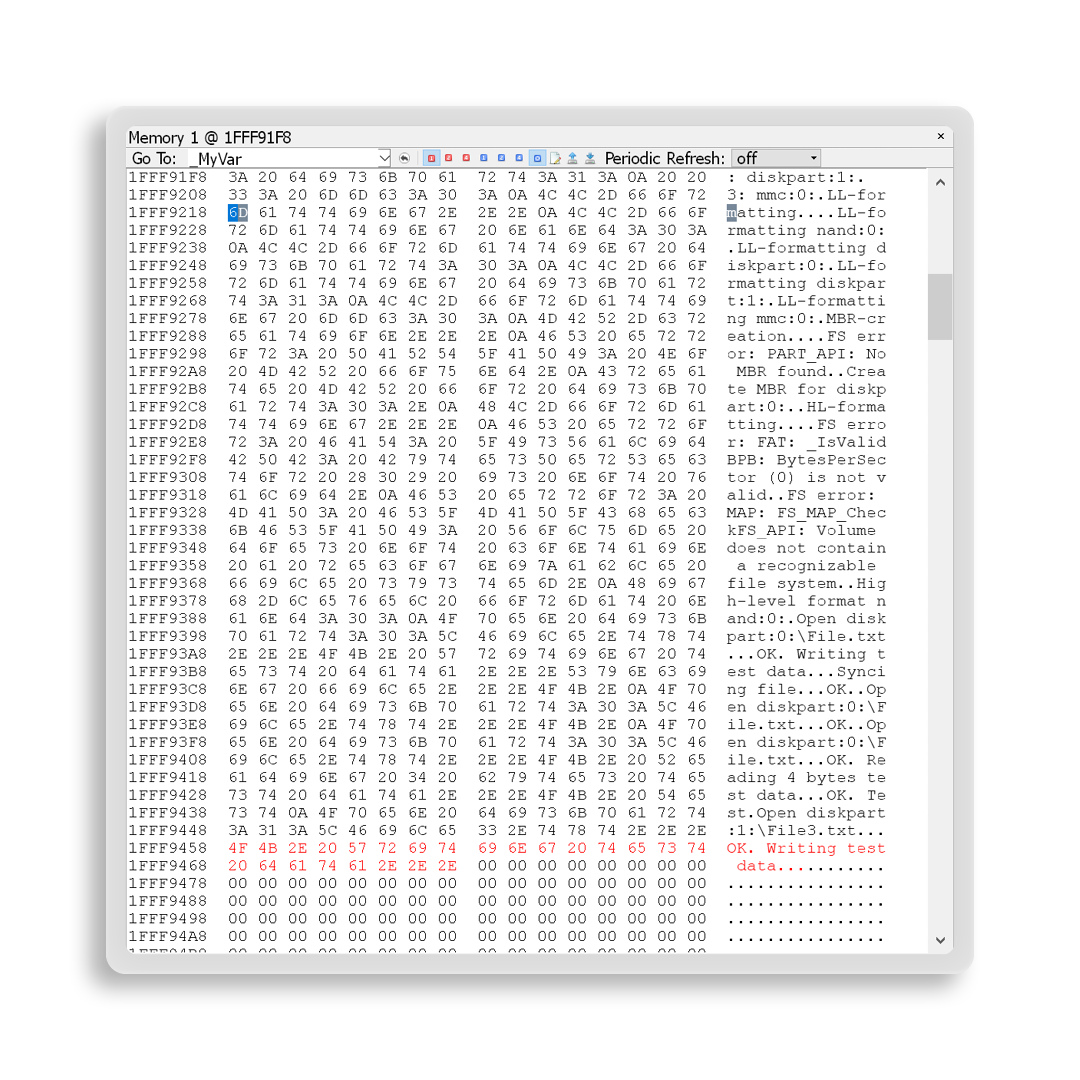
Memory window
The Memory window provides a view into a target system's Flash and RAM. It displays memory contents in a hex editor, which allows memory to be read and modified. In addition, an ASCII representation helps with easy identification of strings and patterns. All data symbols can be revealed and highlighted in the Memory window to aid analysis of complex structs and arrays, as well as of symbol surroundings.
Finally, users can save data from the memory window into a binary image file, or they can load binary image files that are directly downloaded into a target system's memory.
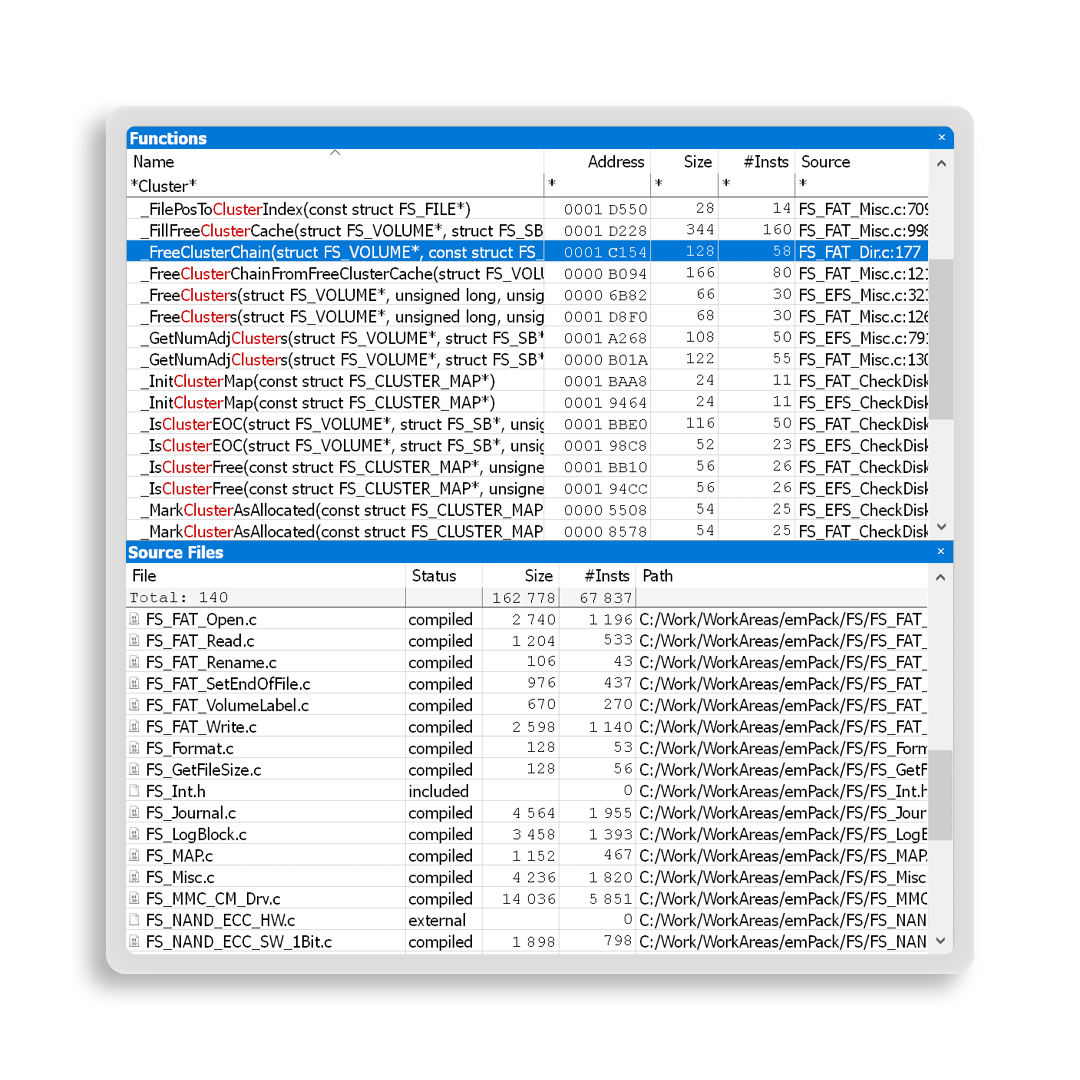
Project information — functions and source files
Ozone can display lists of all functions and source files stored within firmware debug information. With the Functions window, these items are viewable in memory as disassembly code or directly in a source file. Lists include information about addresses, sizes, and numbers of instances. The Source Files window provides information about status (included or compiled) and the location on the file system at build time. Compiled files are also listed with information on size and numbers of instances.