How To Get Started
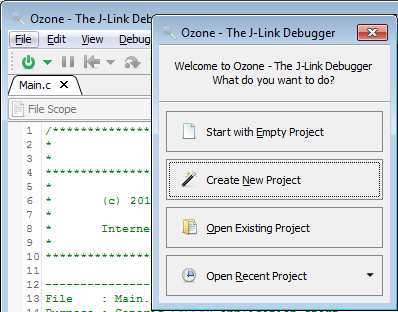
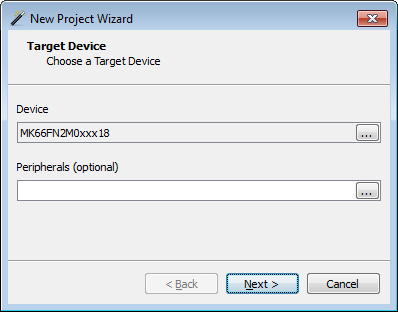
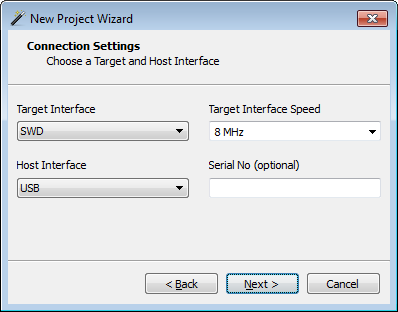
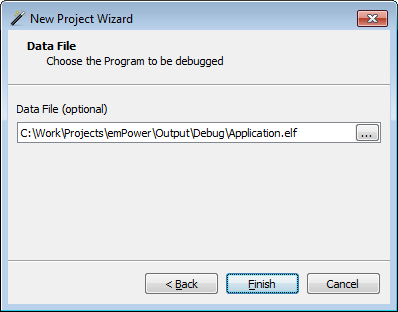
When starting Ozone for the first time, the New Project Wizard will guide through the setup of the first project. Set your target device and the J-Link connection settings. Now select your application data file, which is usually the output (elf) file from your tool chain or IDE. Your first project is ready to run a debug session. You can save your project for further load and modify it, as it is a simple C-like script.
When starting Ozone again, a welcome dialog pops up, to open a recent project, or create a new one.
Debugging with Ozone
Debugging with Ozone can be controlled through the most common keyboard shortcuts or buttons from the toolbars, to be used intuitively.
To start debugging, a J-Link and the target have to be connected to the PC. Ozone can download the application code to the target, if there is a file selected.
A debug session is started with F5 or the green On/Off button from the toolbar.
After starting, the code is downloaded and the application is reset and runs to main(). The reset behavior can be changed via the System Variables.
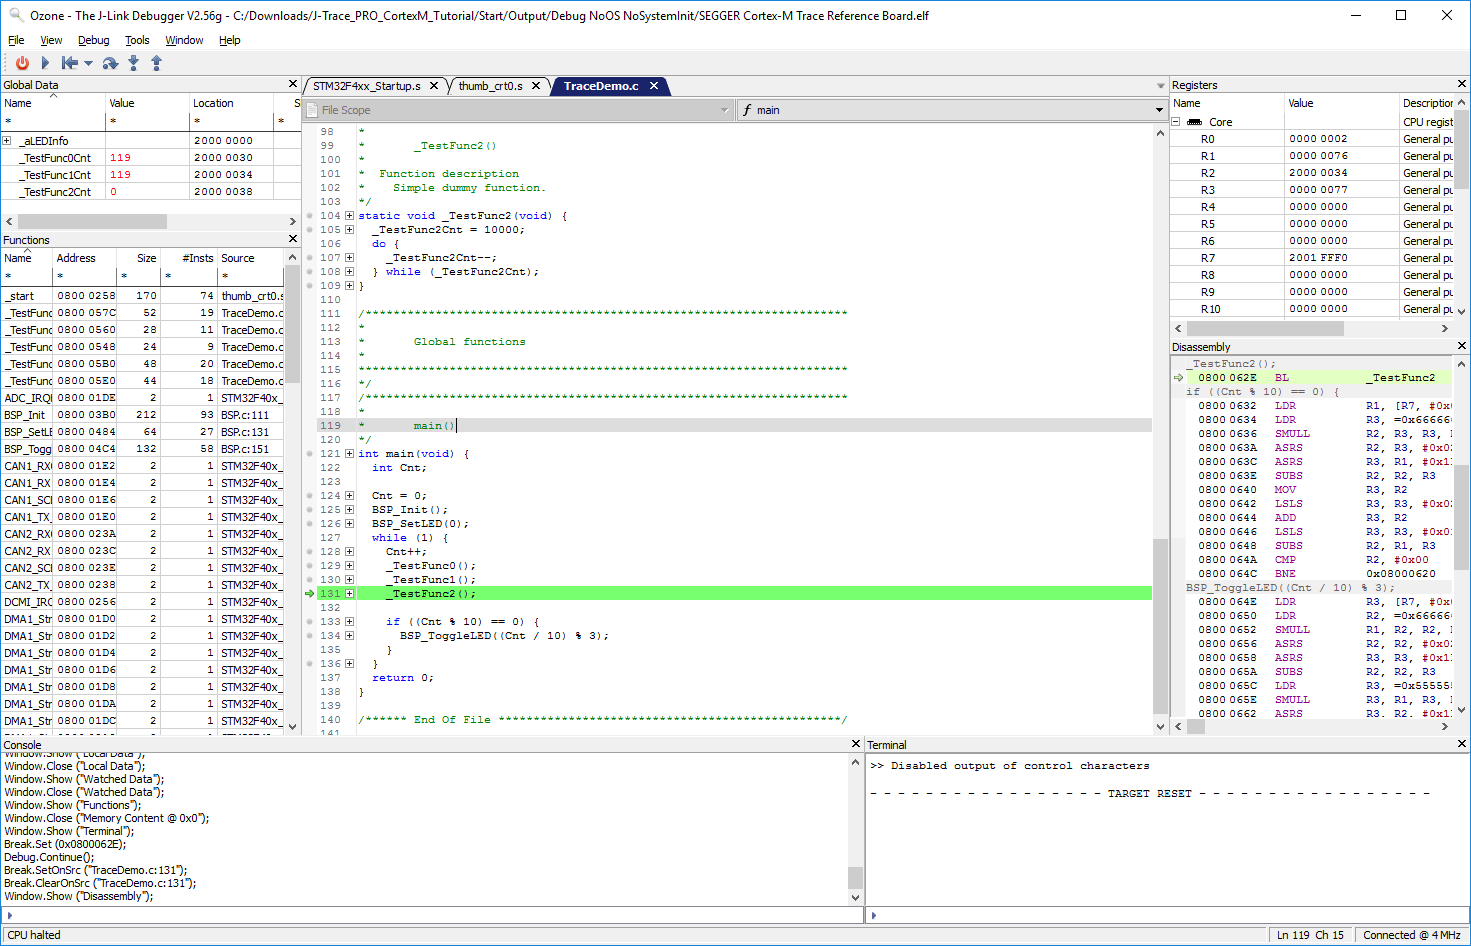
Ozone features the most usable debug information windows to give full overview and control over the target application. The Source Viewer highlights the current line of execution and gives information about the application. The instructions to be executed can also be shown in the Disassembly. Ozone allows stepping on source level, as well as on instruction level. The Memory, Global, Local and Watched Data and the Registers Windows show information about the current state and content of the target. The data can also be written and changed from any of these windows.
Ozone includes a Terminal which allows communication with the target in the most common ways. It can display SWO data, handle semihosting commands and show output and send input with SEGGER's Real Time Transfer (RTT) technology.
Trace tutorial
The Ozone J-Trace PRO Tutorial serves as a starting point for you to test J-Trace PRO’s streaming trace and live analysis capabilities. It demonstrates how you can get the most advanced analysis of your system within 15 minutes.
Step-by-step guide to start tracing with J-Trace and Ozone...