Embedded Studio
Plug-in
The kernel awareness plug-in gives perfect insight into embOS.
Thread aware debugging
When debugging an embOS-based application, the system is often halted while the Idle task is running. In such cases, the current registers and call stack provide only limited insight into the actual state of the application.
Thread-aware debugging enables the debugger to display all embOS tasks and inspect the context of any task, regardless of whether it is currently running.
Key capabilities include:
- Display all existing embOS tasks when the target is halted.
- Select any task and inspect its CPU registers and call stack.
- Monitor both active and inactive tasks.
- Inspect embOS objects and kernel primitives.
- Gain immediate insight into the overall system state instead of only the currently executing task.
SEGGER's embOS plug-in for Embedded Studio provides full embOS awareness during debugging sessions and makes thread-aware debugging available directly within the IDE.
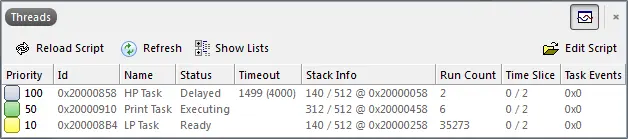
Task sensitivity
The source code window, the disassembly window, the register window, and the call stack window of the Embedded Studio debugger are task sensitive. This means they display the current position in the code, the content of the general-purpose registers and the call stack for the selected task. By default, the selected task is the running task, which is the usual behavior that the user expects from a debugger. You may, however, examine any task by double-clicking on the corresponding row in the plug-in window. The selected task will be highlighted and the call stack and preserved general-purpose registers of the suspended task are rebuilt.
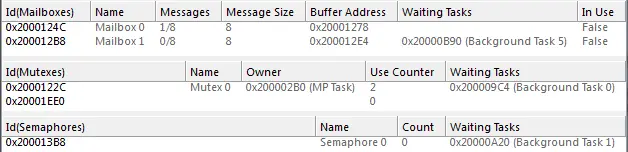
embOS object lists
In addition to the task list, the plug-in provides for all embOS objects if Embedded Studio version 3.40 or greater is used. These lists can be activated individually and show information specific to the embOS objects.