Analyzing & recording runtime behavior on embedded systems with SEGGER’s SystemView
SystemView is a real time recording and visualization tool for embedded systems. It can dig deep, revealing an application’s true runtime behavior. This often returns deeper insights than most debuggers provide.
The following webinar shows SystemView in action. Take a look and see this real time recording and visualization tool in action. The following features are demonstrated in the webinar: data collection, data extraction, data visualization & data analysis.
Data Collection, Visualization and Analysis with SystemView
In our webinar we demosntrate how SystemView works. Embedded systems insights are deeper thanks to the real time recording and visualization capabilities that SystemView offers. For anyone working with complex embedded systems, it is highly beneficial.
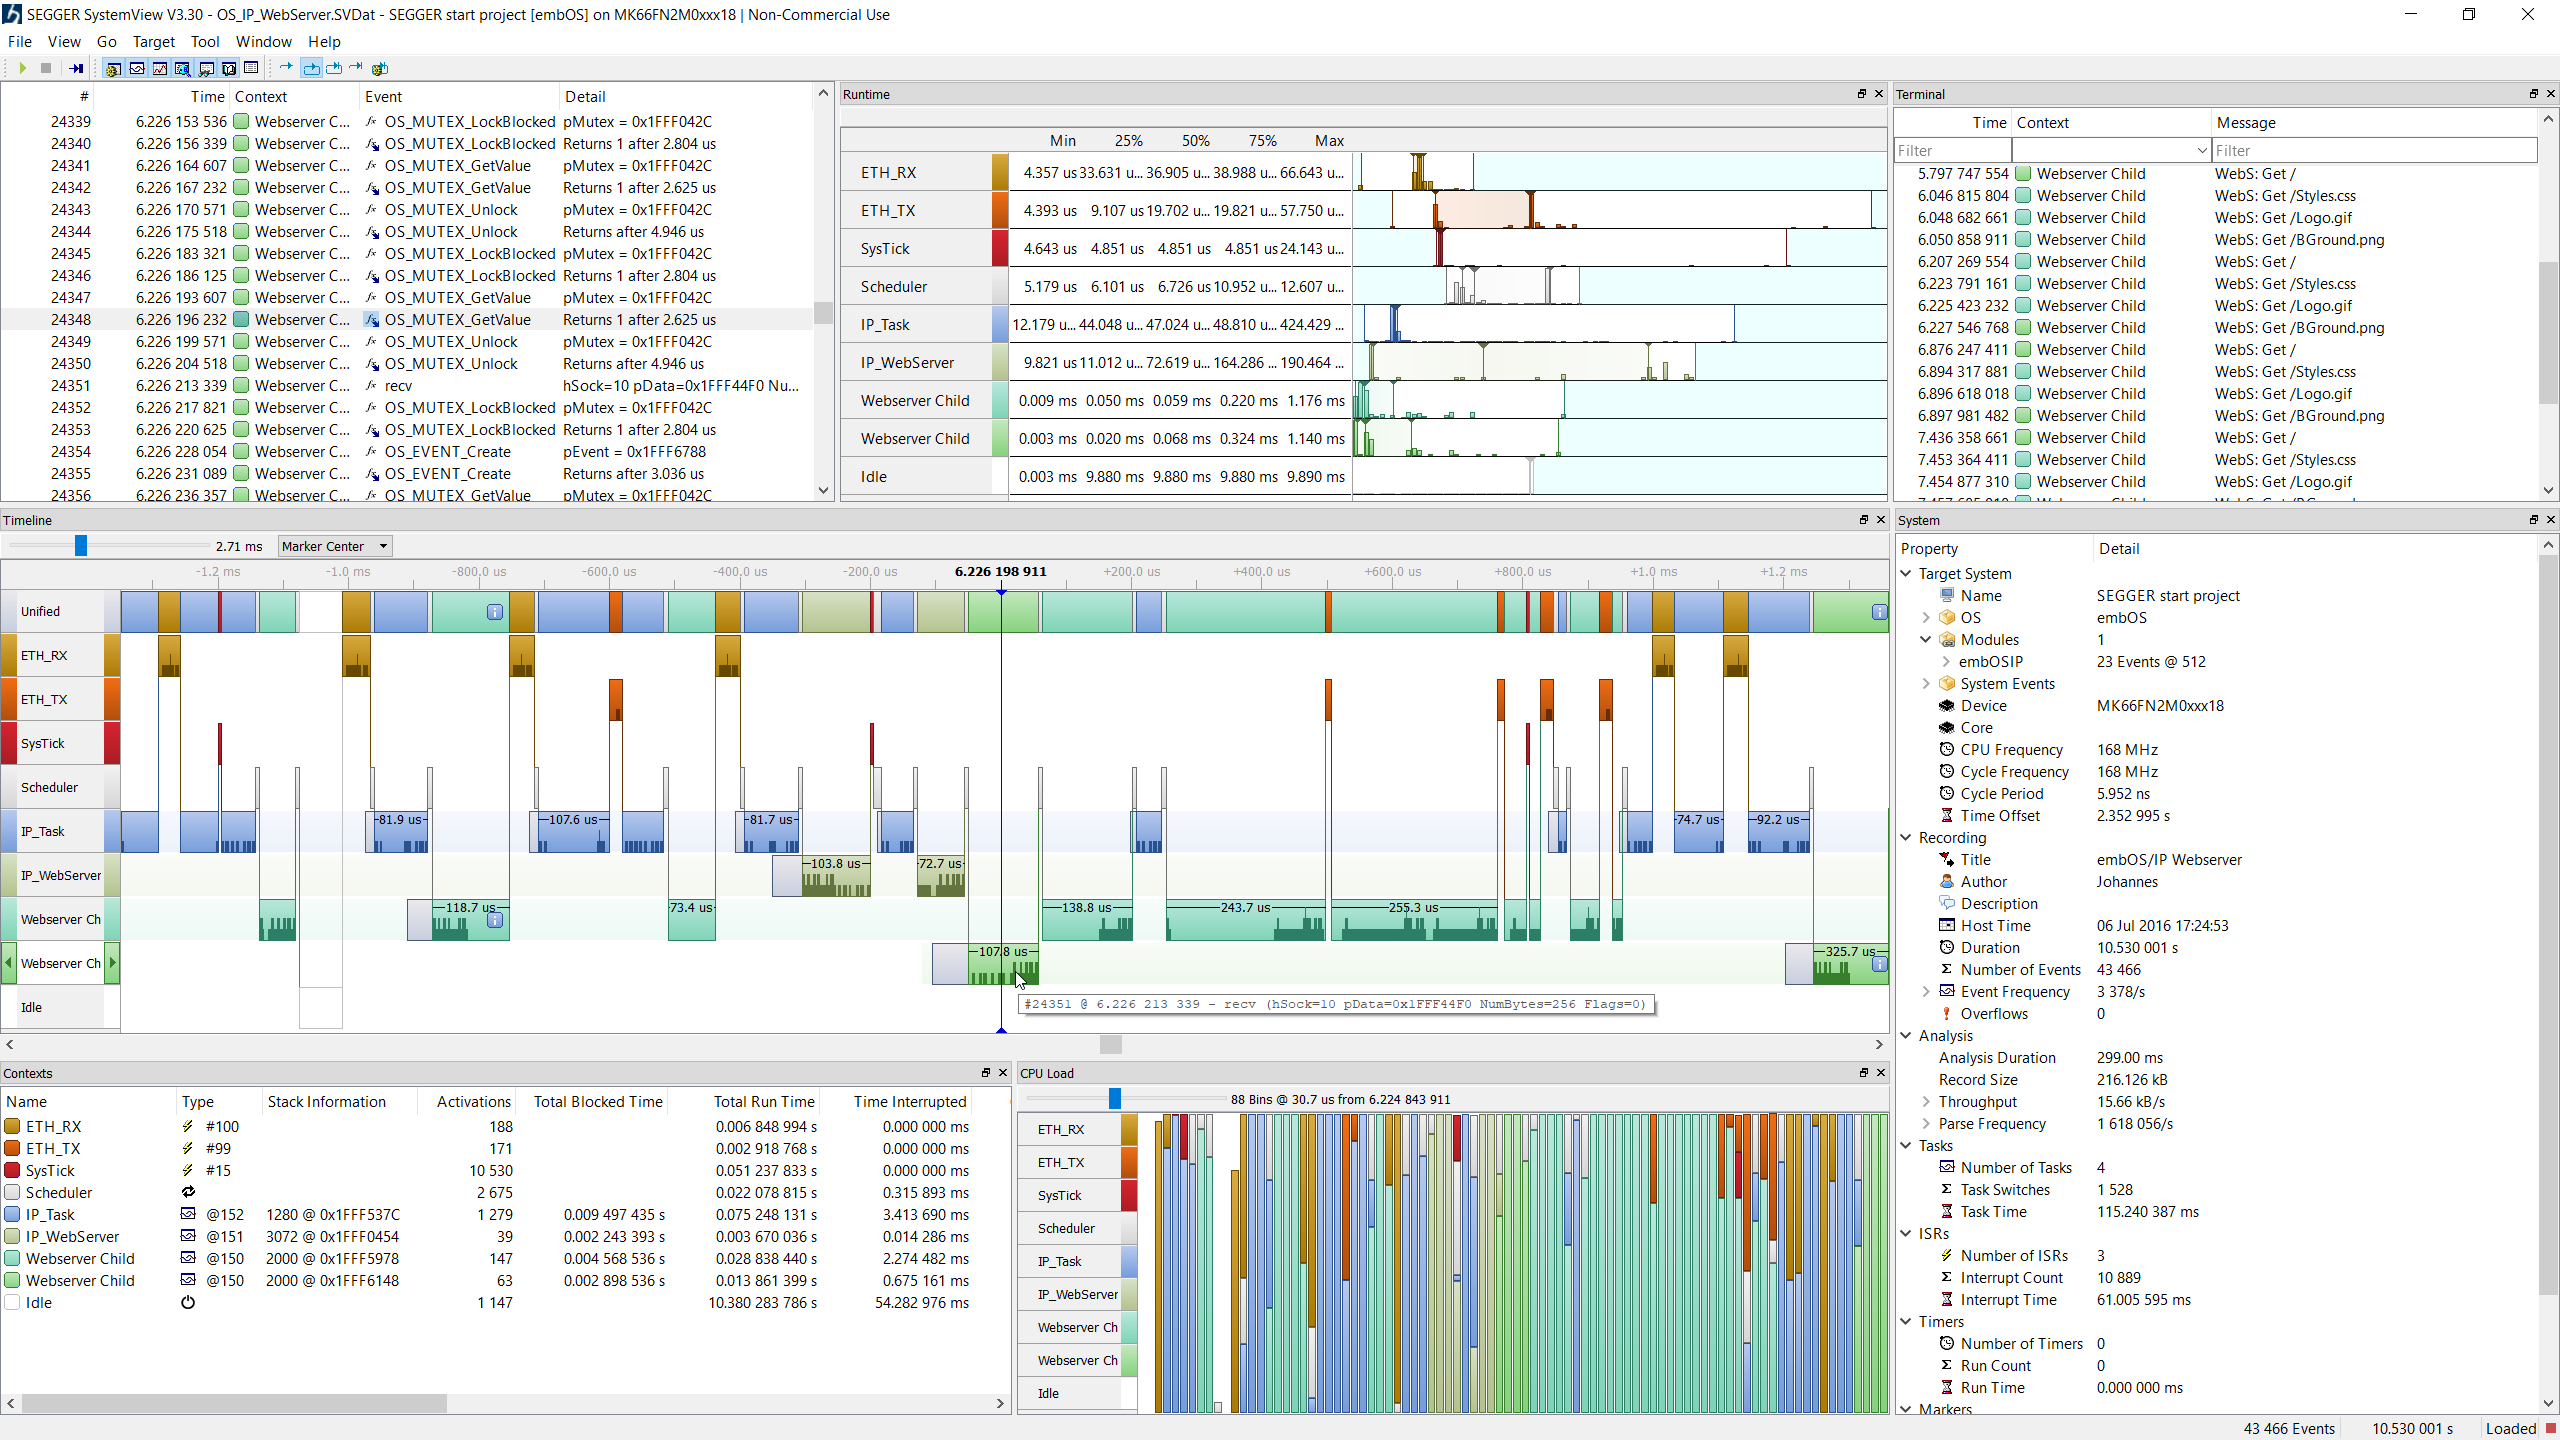
SystemView makes it possible to analyze…
- Which interrupts, tasks, and software timers have executed,
- how often,
- exactly when,
- and how much time they have used.
What’s more: SystemView is minimally intrusive and works on any CPU. When recording, this tool offers three different modes.
Multi-platform, SystemView works with Linux, macOS and Windows. Curious? Learn more about SystemView.
Data Extraction with Real Time Transfer (RTT)

We also show you how SystemView works together with RTT. SystemView passes events to RTT, together with a configurable, high-accuracy timestamp. Timestamps can be as accurate as 1 CPU cycle, which equates to 5 ns on a 200 MHz CPU. The RTT software module stores the data in the target buffer and allows continuous recording with a J-Link on supported systems, as well as single-shot recording and off-line analysis on any system. SEGGER's proven technology for system monitoring and interactive user I/O in embedded applications combines the advantages of SWO and semihosting at very high performance.
RTT can be used with any SEGGER J-Link debug probe and any supported target processor supporting background memory access. It makes it possible to output information from the target microcontroller as well as sending input to the application at a very high speed with minimal impact on the target's real time behavior.
Find out more about RTT.
Missed the Webinar?
The four elements needed to keep track of what's going on inside your Embedded System are collecting the required information on the target MCU, extracting the information from the target MCU at a very high speed with minimal impact on the target's real time behaviour and visualizing and analyzing the information on a computer. A live demo with SystemView and SEGGER RTT shows the incredible possibilities.
Want to see SystemView in action, but missed the webinar? Not to worry: We have a recording you can watch below.