Setting up Trace
The following tutorial will explain how to setup streaming trace on a J-Trace PRO by using Ozone as a debugging tool. More information to streaming trace is available here: Streaming Trace.
General Setup information
For a working pin trace setup the following is required:
- J-Trace PRO
- Latest J-Link software
- A target device that supports tracing
- A trace capable board
Generally the J-Link software will try to autodetect and initialize all architecture specific registers to enable tracing. However on some chips there are additional chip specific initialization steps that are required for tracing to work. This can be done via a JLink Script file.
Getting started with Ozone
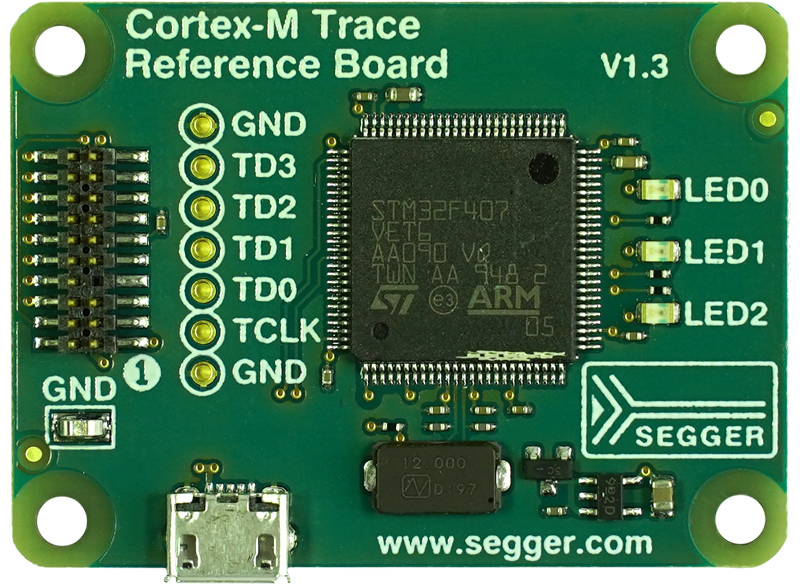
The easiest and fastest way to get started with tracing is using the included Cortex-M Trace Reference Board.
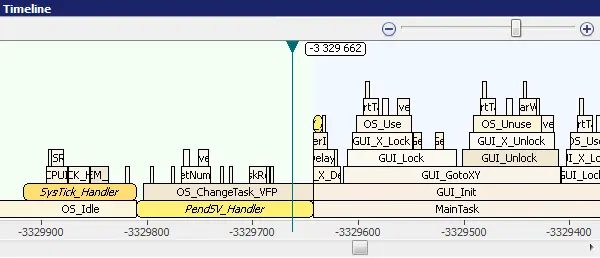
For the best trace experience it is recommended to use our universal Debugger Ozone.
With Ozone and the trace tutorial project you should be up and running with your first trace session within 5 minutes.
Getting started with your own target device
If you are looking to get started on a different target device than the one on the Cortex-M Trace Reference Board we recommend to first take a look at our tested devices page.
The tested devices page contains a large collection of out-of-the-box examples for nearly every trace capable evaluation board that is publicly available.
So simply check the list if your target device or eval board is present and try the example project out. Just make sure that if you are using a custom board that you are using the exact same trace pins as the pictured eval board.
If that is the case and the example project works, simply reuse the .JLinkScript/.pex file which is in the example project and set it in your own custom Ozone project.
Should you use different trace pins than the eval board you will have to create your own trace pin initialization as explained in our Wiki.