Instruction trace
Ozone’s instruction trace allows for the recording, analysis and even replay of every executed instruction on an embedded system.
With the direct integration of J-Trace, Ozone can non-intrusively capture and analyze the runtime behavior of a system using embedded targets’ trace modules. Instruction trace is the fundamental information provided by trace data. Every fetched or executed instruction is recorded and provided to the debugger. J-Trace’s streaming trace capability ensures that all this information is available for analysis.
What is Instruction Tracing?
Instruction tracing is a non-intrusive way to capture what an embedded system really executes. A component on the target CPU (such as the Embedded Trace Macrocell (ETM) on a Cortex-M microcontroller) makes this available. The trace component captures the events on the instruction bus, generates information about instructions and makes it available for storage in RAM or transmission to the trace probe. This information is then either stored to a small buffer in RAM, or to an output on the debug interface to the trace probe.
With a streaming trace probe, J-Trace, all trace information is received from the target system and immediately transferred to the debugging host computer for further analysis. Trace buffers in target RAM or on a trace probe only offer limited information such as storing the most recently-executed instructions. Streaming trace capability, however, enables the recording, storing and analyzing of the whole target system execution from start to end.
Instruction Tracing with Ozone
Ozone displays the most recently-executed instructions in its Instruction Trace Window, providing basic information. This enables analysis of the systems last actions, providing a step back in time.
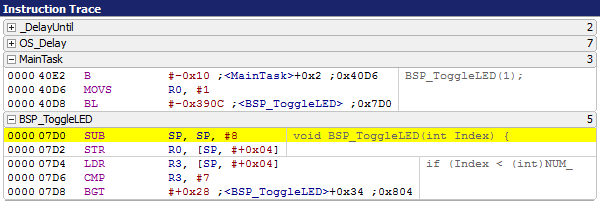
The Ozone Instruction Trace displays the application’s instruction history in the form of a list of machine instructions. This is similar to a disassembly window, but in the order of execution. The list runs from most recently-executed (at the bottom) to least recently-executed (top).
Executed instructions are grouped into call frame blocks. Each call frame block contains the set of instructions that were executed within the current frame: for example, between the entry of a function to the call of a sub-function. Call frame blocks can be collapsed or expanded to hide or reveal the affiliated instructions. The number of instructions executed within a particular call frame block is displayed in the block's header.
Timing information allows the Instruction Trace Window to provide more detailed information about how long the execution of a block took. Depending on the time information’s granularity, the duration of blocks, functions or even single instructions can be measured.
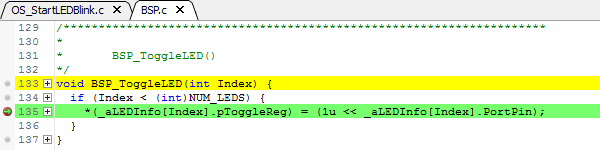
Both the Source Code Viewer and the Disassembly Window are synchronized with the Instruction Trace Window. They highlight the instruction or corresponding source line of the instruction selected in the Instruction Trace Window. This allows for a look back in time, replaying the system execution not only on an instructional level but actually line-by-line.