Ozone system and performance analysis
System and performance analysis based on data from instruction traces, power consumption, and data samples
System analysis
Ozone helps developers understand how their embedded systems perform. It gathers a range of valuable information on instruction traces, power consumption, data samples, and more. Performance-analysis features make it easy to understand and optimize a system.
Supported technologies

Instruction tracing
Ozone can utilize instruction traces from a target system via J-Trace streaming trace probes. These probes collect precise information on the program flow.
Power profiling
With a J-Link powering a target system, Ozone can read a target's power consumption at a rate of up to 100 kHz with a resolution of 50 µA.
High-Speed Sampling
When paired with a J-Link, Ozone can use High-Speed Sampling technology to directly read out target-system symbols with no overhead and at time resolutions down to 100 µs.
Timeline window
The Timeline window provides a unified view of instruction-trace data, power-consumption data, and symbols collected via High-Speed Sampling. Each type of data (instructions, power, symbol data) has its own pane in the Timeline window. All panes share the same time scale and position, which makes it easy to correlate events in code to power consumption or to changed symbols and expressions. Users can set reference points to measure time intervals between points or between a point and a cursor, which is valuable for identifying opportunities for optimization.
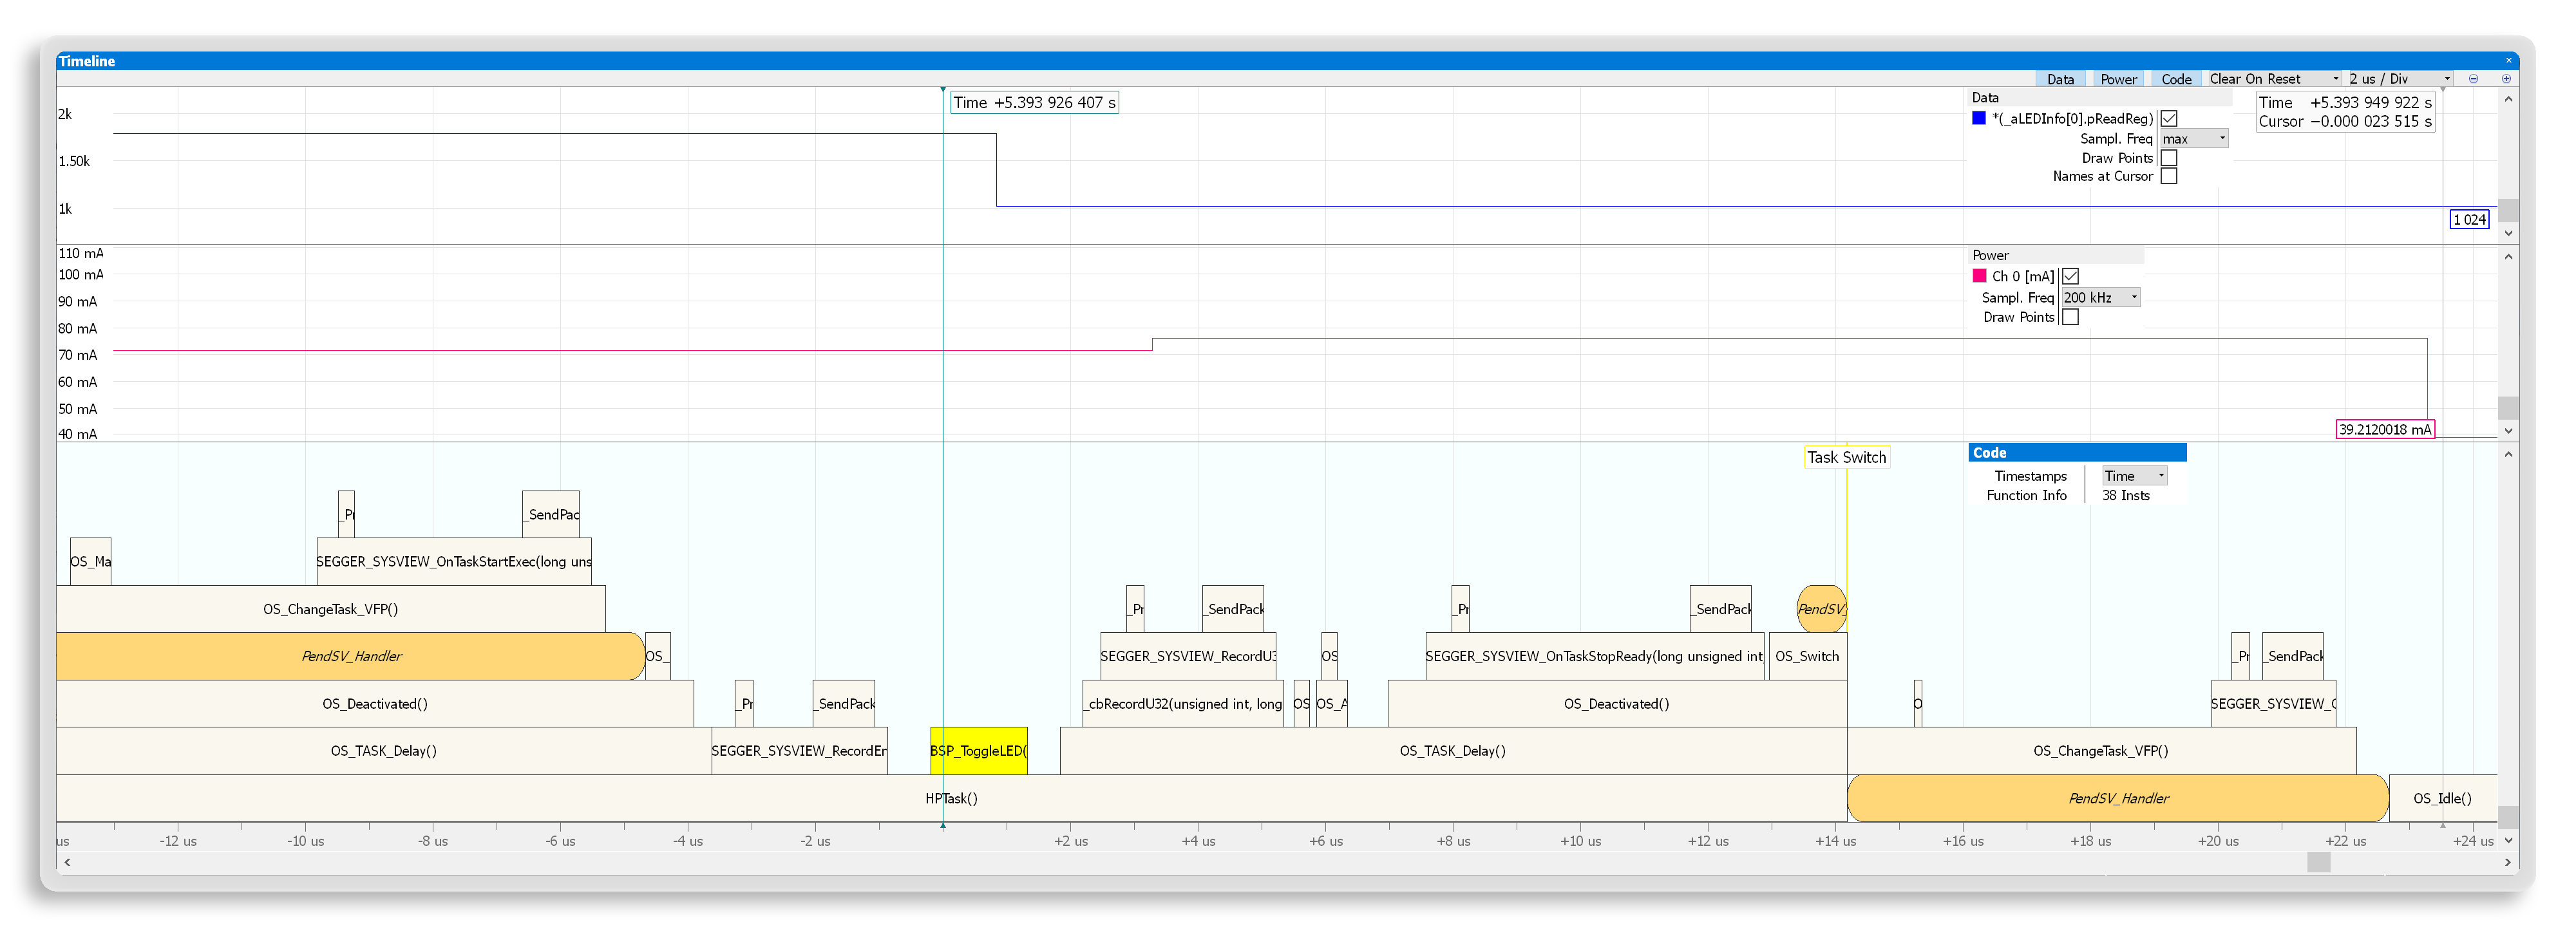
Instruction-trace visualization
For an instruction trace, a timeline creates a visualization of the call stack using frames to display a function's invocation. Discontinuities in program flow (such as interrupts and context switches) are highlighted with a change in background color, which enables users to easily identify these highly significant events.
Based on this view, users can easily measure how long a function call took, which sub-routines were called, and how much time was spent in sub-routines. With RTOS awareness, the call stack also makes it easy to identify task switches. The cursor in the timeline synchronizes with the Instruction Trace window.
Power measurement
Ozone visualizes energy consumption measured by a debug probe in the Timeline window. By showing the amount of power used over time, Ozone helps users see how much power a specific device requires.
When carrying out instruction tracing, users can correlate changes in power consumption with code, as well as understand how firmware execution and peripheral switching influence that consumption. To assist users in assessing a target system's energy efficiency, Ozone can display a running average.
Data plotting
The Data Plot window displays symbols and expressions over time. Visualization makes it easy to observe state- or value-related changes. Combined with a trace visualization, a data plot adds visual cues about the effects of code on state- and value-related changes.
The symbol values are collected using High-Speed Sampling, which provides more updates than low-frequency live watches. Additional information (such as data samples and related statistics) are available in the Data Sampling window.
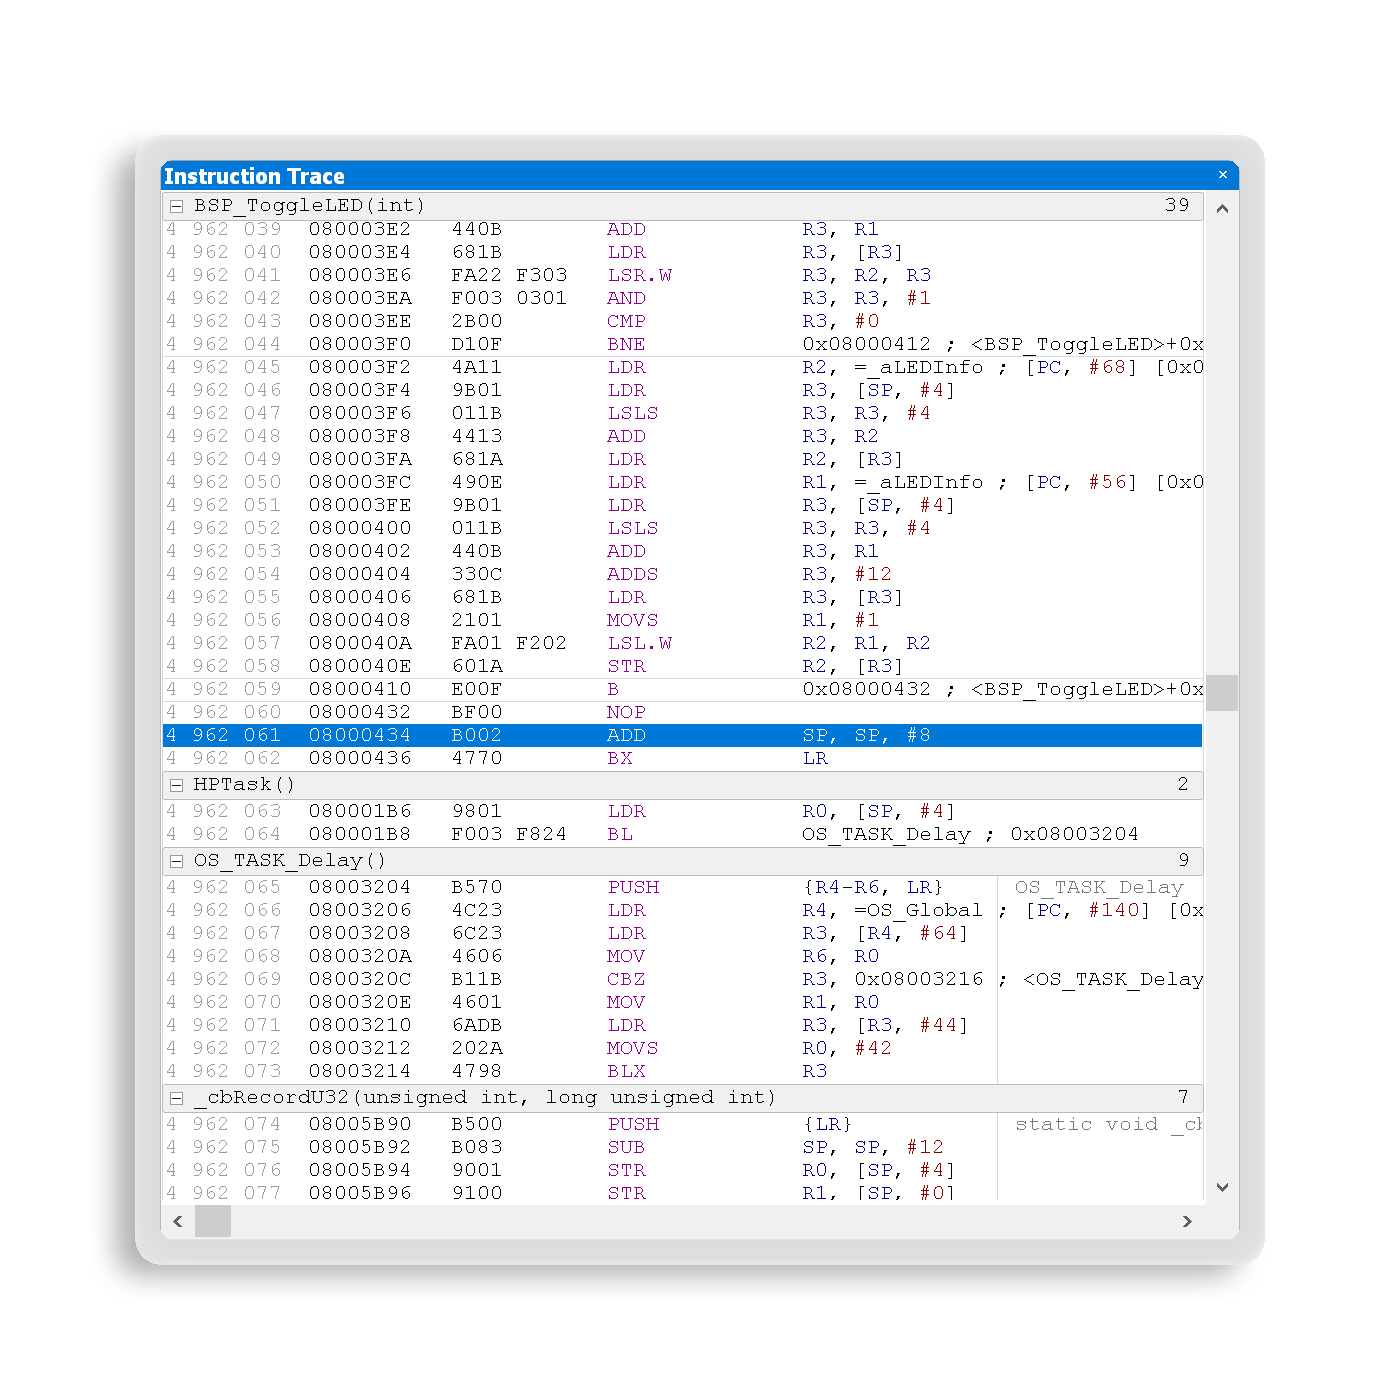
Instruction Trace window
The Instruction Trace window displays complete instruction-trace information acquired from a connected trace probe when a target is halted. This enables stepping back in time and precisely tracing back the instructions executed before a system reached its current stopping point. When an exception (such as a mem fault or a bus fault) causes a system to halt, the trace can be used to identify the instruction triggering the fault.
While tracing back, the executed code is also highlighted in the source viewer. Users can easily identify and analyze the responsible code context.
Performance analysis
Code coverage
Code coverage is, among other things, an important tool for verifying whether test suites cover a complete target application. Ozone offers a modern way to provide code coverage data using a live system instead of a simulated environment.
Code profiling
Code profiling is a tool for identifying “hot spots” for potential optimization. Ozone provides this capability based on streaming-trace data, and it enables profiling to be carried out with a real, live system.
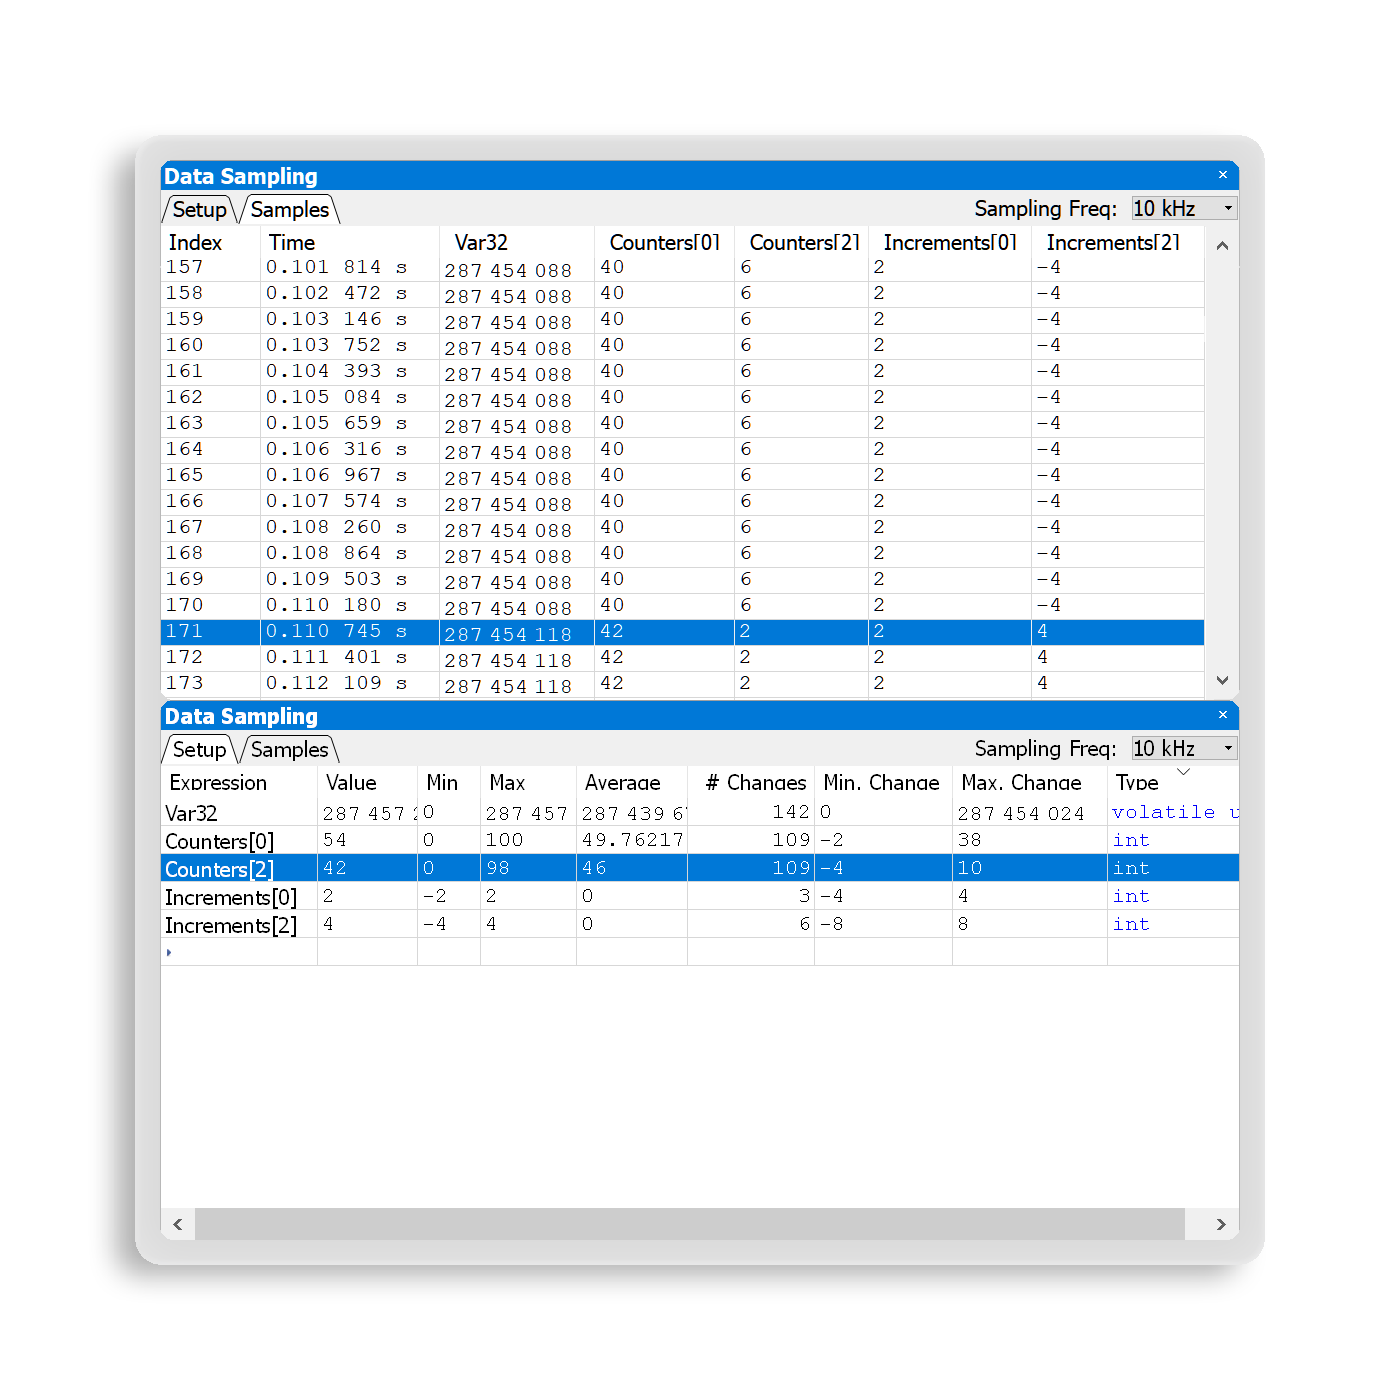
Data sampling symbols and expressions
The Data Sampling window adds statistical data related to recorded symbols and expressions, such as minimum value, maximum value, average, change frequency, and the largest and smallest value changes. The additional information helps users analyze complex systems. Individual samples are also available and can be exported for further analysis with external tools.