Verifying and testing embedded software on multicore systems
Monitor and analyze interactions among multiple CPU cores in real time.

Overview
Multicore support enables SystemView to seamlessly monitor embedded systems with multiple CPU cores on a single chip, transforming real-time software verification and analysis. With the ability to collect, analyze, and visualize core data in real time, SystemView gives embedded software developers the insight they need to verify and optimize complex multicore interactions.
Why use multicore support?
Multicore support allows developers to analyze the runtime behavior of firmware in the context of an entire embedded system. It facilitates validation of co-processor execution and ensures proper control from a main core. Additionally, it helps verify inter-processor communication, synchronization, and locking mechanisms, making it an essential tool for testing embedded software and optimizing multicore systems.
Key features
SystemView’s multicore support introduces multiple powerful features for gaining insight into multicore systems. It supports both RTOS and bare-metal environments, ensuring flexibility for a variety of project setups. Additionally, it also includes sample recordings, which allow users to easily obtain a quick overview of how the tool works.
Real-time data collection
Data can be captured across multiple cores simultaneously with SEGGER’s Real-Time Transfer technology.
Individual and grouped views
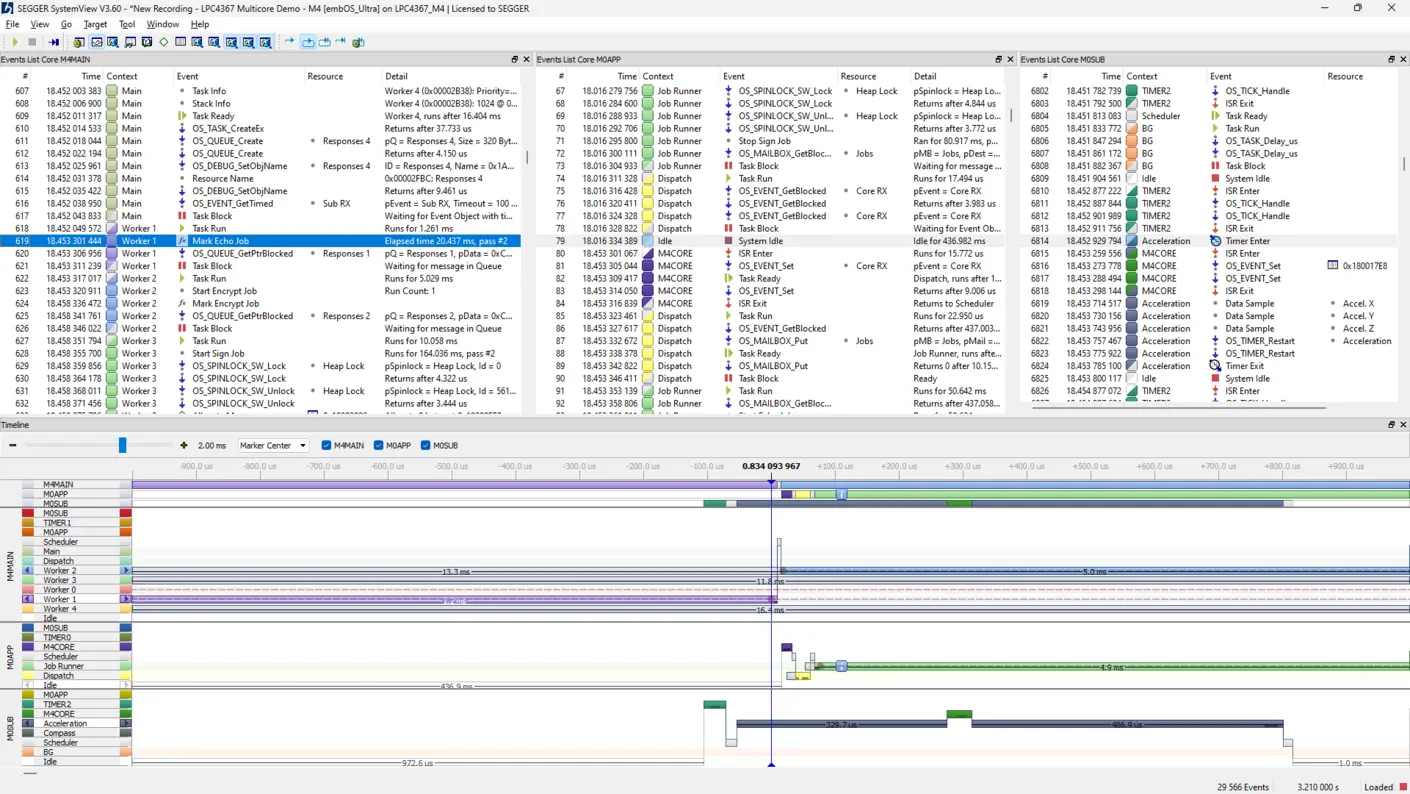
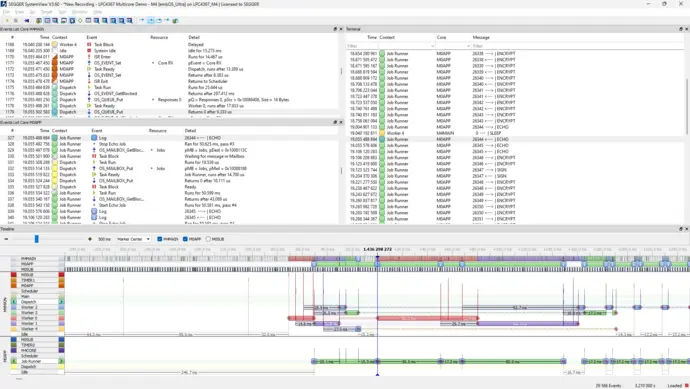
Events for each core can be visualized individually or as a combined system, allowing for analysis of inter-core interactions.
Platform flexibility
Regardless of the core architecture and operating system in use, SystemView works with a wide range of setups and provides a coherent overview for any system.
How multicore support works
For every core that runs instrumented firmware, SystemView’s multicore functionality enables the recording of relevant events, such as context switches between tasks, interrupts, function calls, heap and stack usage, data samples, log messages, and more. The embedded software testing tool collects data from multiple cores simultaneously without requiring synchronization between them.
Each core can operate at its own speed, and SystemView records events into dedicated channels for every core. Timestamps, accurate to a single CPU cycle, are correlated across all cores to present a unified system timeline. This approach enables embedded software developers to visualize core-specific data or analyze the combined behavior of the entire system, making it easier to identify issues, optimize performance, and validate inter-core communication.
Events list
The Events List window provides a comprehensive overview of all activities within a system. Across each core, events are displayed for every task, with individual cores maintaining their own synchronized event lists via timestamps.
Should there be a failure on one core, users can cross-reference events on other cores to understand what occurred at the time of the failure. It is also possible to show event lists for all cores, selectively hide lists deemed less relevant to specific evaluations, or change list order.
Timeline
The Timeline window provides users with a visual system trace of how selected cores interact with one another, as well as a means for observing events at specific moments in time. For example, it is possible to see not only when the main core sends events to the app core, but also the exact moment the app core receives them. The burden of sifting through millions of events is eliminated, as the timeline provides a quick means for checking whether the context is functioning as intended.
Additionally, the Timeline window allows users to select the cores they want to display. If a core performs an action unrelated to the other cores being analyzed, it can simply be hidden, resulting in a clearer view of the information that is most relevant to the user.
CPU load
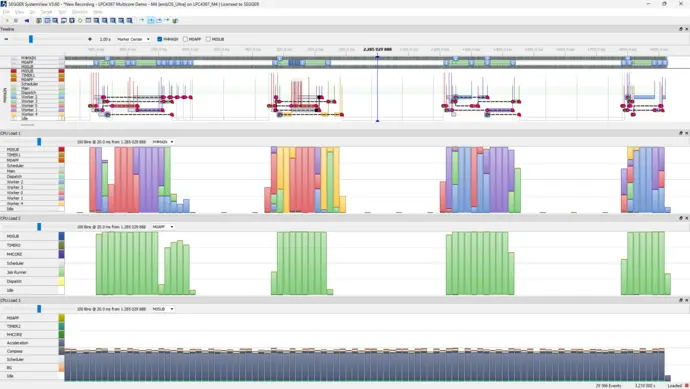
The CPU Load window shows the load for one selected core. Because cores in embedded systems handle different tasks, it is beneficial to view their CPU loads individually rather than collectively. As with the Events List and the Timeline windows, users can select a specific core to view its CPU load.
The CPU Load window offers a detailed view of activity on each core, visualizing context execution over time. Users can easily identify periods of idle time, indicating free computing resources, as well as pinpoint performance bottlenecks when a core reaches 100 % utilization.
Licensing
SystemView is available under SEGGER’s Friendly License, making it free to use for educational and non-commercial purposes. The tool can also be evaluated for commercial projects without any limitations on features, code size, or trial duration. Simply download SystemView and start exploring its capabilities within minutes.
Get in touch with us
Have questions or need assistance? Our Embedded Experts are here to help!
Reach out to us for:
- Licensing quotes
- Technical inquiries
- Project support


