J-Link GDB
Plug-in
Most embedded systems nowadays make use of a real-time-operating system (RTOS). For these systems thread aware debugging is a very useful feature. J-Link GDB Server supports thread aware debugging via a plugin system.
Thread Aware Debugging
By default, when halting a target system in the debugger, the current registers (program counter, stackpointer etc.) as well as the current call-stack are shown. When running embOS, most of the time, the system will be in the Idle task. So the chance is fairly high that, when halting the system, it will be in Idle and not much information is gained by seeing the current registers and callstack.
Thread aware debugging specifies the capability of a debugger to show all existing tasks of embOS, running on the embedded system when the target system is halted by the debugger. It further allows to select a specific task in the IDE to show the current CPU registers as well as the call stack of that task.

The GDB Server plugin interface
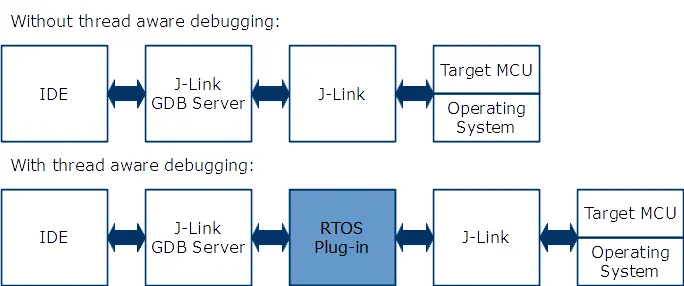
By default, J-Link GDB Server does not know about the RTOS running on the target system and therefore it cannot provide thread specific information that would enable thread aware debugging. For this, an optional plugin for a specific target RTOS (a DLL under Windows or a shared library under Linux and macOS) can be specified to be loaded, when starting J-Link GDB Server. This way, when halting the target system, the debugger will request information about the number of threads that currently exist. As the plugin knows about the structure of the RTOS, it can provide this information to J-Link GDB Server whichen then can provide it to the IDE.
Which IDEs are supported for thread aware debugging?
In general, thread aware debugging should work with any Eclipse + GDB based environment that uses J-Link GDB Server for debugging. So far, it has been tested with the following IDEs:
- NXP Kinetis Design Studio
- Atollic TrueSTUDIO
- ARM DS-5 Development Studio