Advanced debugging on Cortex-M microcontrollers
SEGGER’s J-Trace PRO is the leading trace probe from SEGGER. In this advanced debugging webinar, we’re excited to demonstrate some of the trace probes advanced features. These include: streaming instruction trace, live code profiling & live code coverage. Take a look & and learn how to master these techniques with the top trace probe from SEGGER.
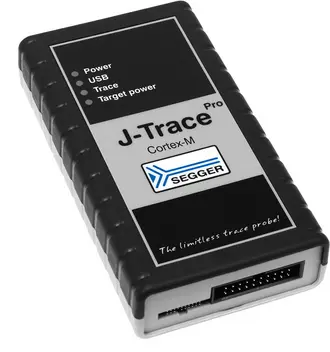
The SEGGER J-Trace PRO Trace Probe
Analysis, verification and profiling code – all with J-Trace PRO, the market-leading trace solution from SEGGER. With this advanced debug probe, the trace features of Cortex-M microcontrollers are supported. It offers real-time streaming trace at full System Clock, allows fine-tuning of applications with code profiling and enables unlimited streaming trace to isolate & identify hidden code defects.
Find out more about J-Trace PRO here.

J-Trace PRO Cortex
J-Trace PRO Cortex-M
J-Trace PRO Features: A Breakdown
What does J-Trace PRO offer in terms of features, and how does it help with advanced debugging? Debugging is a vital part of any development process, since customers want and deserve only the best. Advanced debugging ensures a top notch product, but it has a few intricacies:
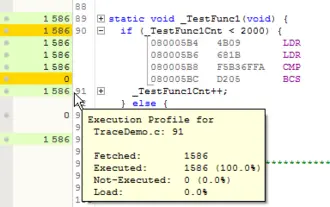
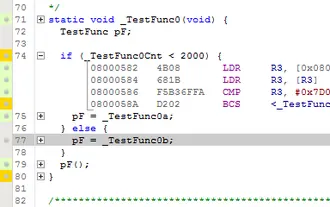
- Instruction Tracing: A non-intrusive way to capture what an embedded system really executes. On Cortex-M microcontrollers, it’s made available by the Embedded Trace Macrocell (ETM). Using a trace probe like J-Trace PRO, you can capture every event on the instruction bus. The trace probe then makes the information (about fetched and executed instructions) available to the user in Ozone.
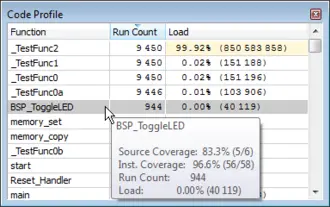
- Code Profiling: Is all about measuring the execution time and frequency of functions, blocks and instructions. It is these metrics that characterize an execution system, highlighting where computing time is spent. And, thanks to Ozone, you’re able to find the optimal potential for optimization: Code that is executed frequently and/or places a high load on the System.
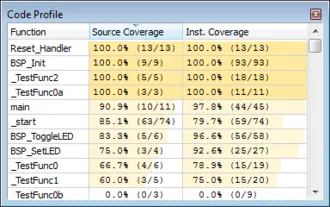
- Code Coverage: Essentially, these are metrics describing code “quality”, since “only tested code is finished code”. With J-Trace PRO and Ozone, the execution of code is measured showing how much of a source line, block, function or file has been executed. It is this information that makes it possible to detect code that hasn’t been covered by tests – even code that may be unreachable.
To learn more, make sure to check out the webinar.
To receive a demonstration of J-Trace PRO and Ozone, please contact our sales team.
Missed the SEGGER Advanced Debugging Webinar?
Perhaps you didn’t get a chance to see our SEGGER Webinar – “Advanced Debugging: Streaming Instruction Trace & Live Code Coverage/Code Profiling on Cortex-M Microcontrollers”?
Not to worry – you can still see Axel Wolf demonstrate SEGGER’s advanced debugging techniques! Take a look at the video below and see how we do it with the J-Trace PRO trace probe and the Ozone J-Link Debugger & Performance Analyzer.
