J-Link SWO Viewer
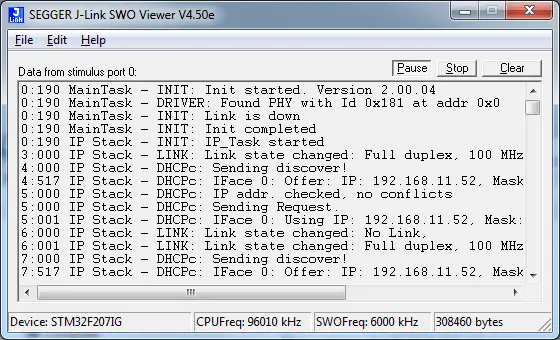
J-Link SWO Viewer is a tool which allows showing terminal output of the target performed via the SWO pin.
Overview
J-Link SWO Viewer is a tool which allows showing terminal output of the target performed via the SWO pin. It can be used without a debugger when the application runs stand-alone to still perform some log output or side by side with a debugger such as GDB or GDB/Eclipse which does not support terminal output via SWO.
Licensing
The J-Link SWO Viewer comes as part of the J-Link Software and Documentation Package. The software package is free for any J-Link or J-Trace device and can be downloaded here:
System requirements
| Supported OS | |
|---|---|
| Windows | Microsoft Windows (x86/x64) |
| macOS | macOS (x86/Apple Silicon) |
| Linux | Linux (x86/x64/Arm) |
Technical background
SWO is a dedicated pin of ARM's Cortex-M debug interface.
While it can be used to output various information in real time by the CPU, it's main usage is terminal I/O in real time with very low intrusion.
Most programs can perform debug outputs without losing their real time behavior.
Example code
Simple implementation for output via SWO for Cortex-M processors. It can be used with any IDE. This sample implementation ensures that output via SWO is enabled in order to guarantee that the application does not hang.
/*********************************************************************
*
*       Prototypes (to be placed in a header file such as SWO.h)
*/
void SWO_PrintChar  (char c);
void SWO_PrintString(const char *s);

/*********************************************************************
*
*       Defines for Cortex-M debug unit
*/
#define ITM_STIM_U32 (*(volatile unsigned int*)0xE0000000)    // Stimulus Port Register word acces
#define ITM_STIM_U8  (*(volatile         char*)0xE0000000)    // Stimulus Port Register byte acces
#define ITM_ENA      (*(volatile unsigned int*)0xE0000E00)    // Trace Enable Ports Register
#define ITM_TCR      (*(volatile unsigned int*)0xE0000E80)    // Trace control register

/*********************************************************************
*
*       SWO_PrintChar()
*
* Function description
*   Checks if SWO is set up. If it is not, return,
*    to avoid program hangs if no debugger is connected.
*   If it is set up, print a character to the ITM_STIM register
*    in order to provide data for SWO.
* Parameters
*   c:    The Chacracter to be printed.
* Notes
*   Additional checks for device specific registers can be added.
*/
void SWO_PrintChar(char c) {
  //
  // Check if ITM_TCR.ITMENA is set
  //
  if ((ITM_TCR & 1) == 0) {
    return;
  }
  //
  // Check if stimulus port is enabled
  //
  if ((ITM_ENA & 1) == 0) {
    return;
  }
  //
  // Wait until STIMx is ready,
  // then send data
  //
  while ((ITM_STIM_U8 & 1) == 0);
  ITM_STIM_U8 = c;
}

/*********************************************************************
*
*       SWO_PrintString()
*
* Function description
*   Print a string via SWO.
*
*/
void SWO_PrintString(const char *s) {
  //
  // Print out character per character
  //
  while (*s) {
    SWO_PrintChar(*s++);
  }
}
