Code analysis
Embedded Studio features different means of application analysis, such as memory use display, static stack analysis, and static code analysis. You get all information to improve your application even before you start debugging.
- Display memory usage
- Static stack analysis
- Static code analysis
- Symbol information windows
- Code outline browser
During development or after the source code of an application has been written, it can be helpful to get more information about the code and what the compiler created from it.
You might have memory use requirements and need to check if there would be enough free memory, or you want to see which data structures eat up most of your RAM to locate and improve them, or you want to verify that some symbols or functions are actually in that memory region where you want them to be.
Embedded Studio offers various features and windows that provide you with enough information to analyze your application even before debugging.
Memory Usage
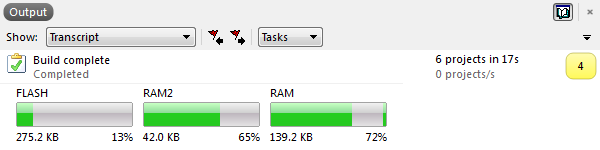
After your application has been successfully built, the log window displays the memory usage for your target device. You can immediately see how much Flash and RAM is used by your application.
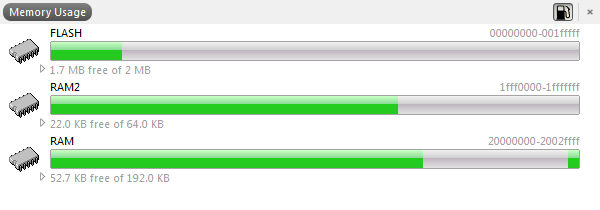
The Memory Usage Window goes more into detail to show you where the sections, i.e. code and data, are placed. The memories and its sizes are taken from your device and settings. It displays all memories you configured, such as internal Flash, RAM and also external memories.
Code Outline
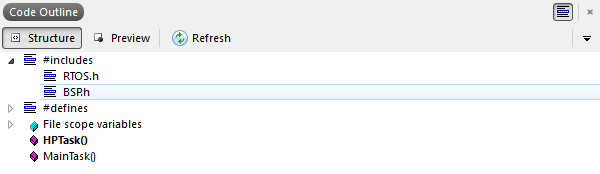
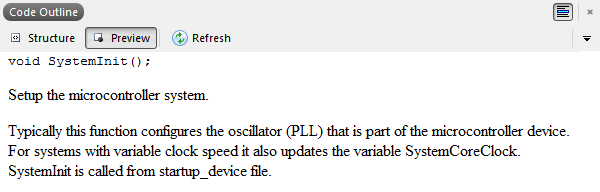
Large source files with hundreds of lines can be complex and hard to understand, which makes locating one function or symbol definition more difficult. The Code Outline Window presents a clear structured outline of your source, which eases navigation through your code. Includes and defines can be grouped in the display, and complex elements can be expanded to show their members. With a single click you can jump to any element.
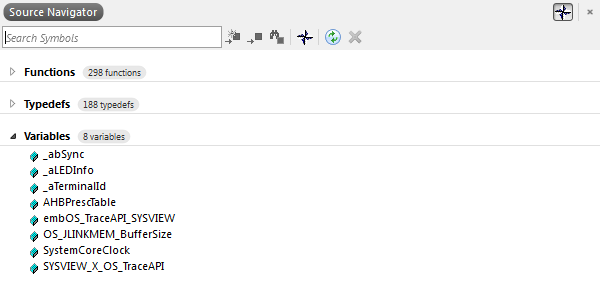
Source Navigator
Even if your project is modular and well structured, it can be hard to remember where a function or symbol is defined. The Source Navigator provides fast access to all your functions typedefs and variables with a single click. You can also use the quick input of Find Symbol (Alt+Y) and Find Method (Ctrl+M) for even faster navigation.
Symbol Browser
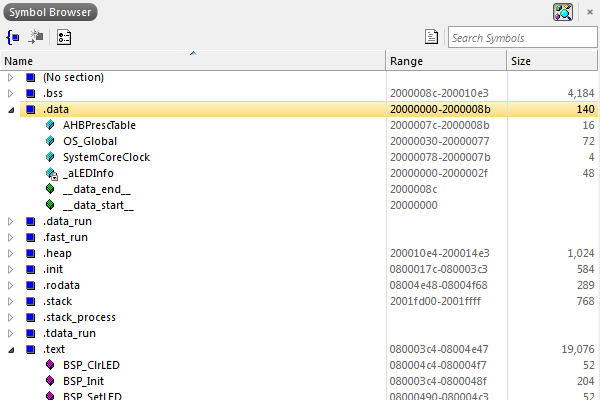
The Symbol Browser provides more insight into the compiled application. You can see how much memory is used by each symbol and where it will end up in your target. Symbols can be grouped in different ways, by source file, section, or type.
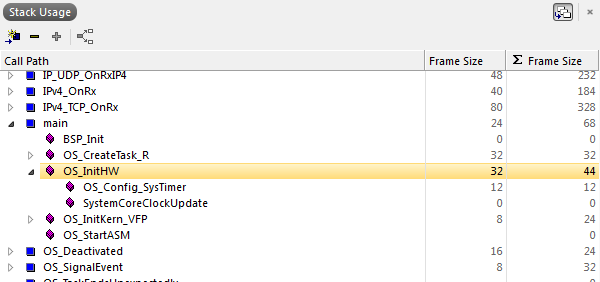
Stack Usage
In most cases it is hard to guess how many stack your application or each task will use. The Stack Usage Window does a static stack analysis of your application and shows the stack use of functions and call paths.
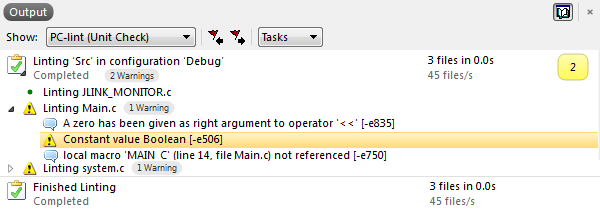
Static Code Analysis
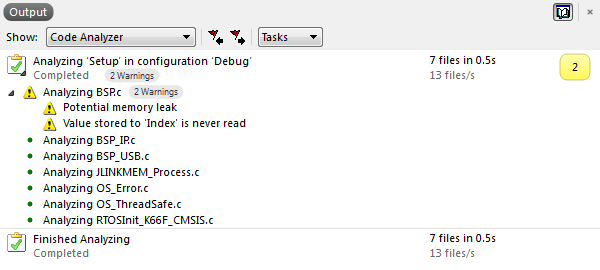
A compiler will usually generate warnings for anything that might break your application, such as uninitialized variables. To find further issues which have no immediate effect but might affect performance and to increase your code quality you can run static code analysis on your sources. All findings will be shown in the log to easily navigate to them.
Find out more about the static code analyzer on our Wiki page.
External Tools
For further analysis of your code, for example to run a MISRA check on your sources, Embedded Studio features the inclusion of external tools. You can add commands to be executed and run them on your project items. The tool output is shown in the log window, and for tools such as Lint you can jump directly to reported source lines.