J-Link GDB Server
Connect GDB-based development environments to J-Link
- Use J-Link with GDB-based IDEs and toolchains
- Access advanced J-Link debug features
- Integrate into interactive and automated workflows

Overview
J-Link GDB Server acts as the interface between GDB-based development environments and a target system connected via J-Link. It can be used with toolchains and IDEs that support debugging via the standard GDB Remote Protocol.
The GDB Server handles communication with the debug probe and translates GDB commands into the corresponding J-Link operations. In addition to standard GDB functionality such as memory access and run control, monitor commands provide access to J-Link-specific features, including flash programming, Unlimited Flash Breakpoints, semihosting, and device-specific functionality.
J-Link GDB Server is available with a graphical user interface or as a command-line application, making it suitable for both interactive development and automated workflows.
Licensing
The J-Link GDB Server is part of the J-Link Software and Documentation Package and is available in a GUI or command-line version. The software package is free for any J-Link or J-Trace device and can be downloaded here:
System requirements
| Supported OS | |
|---|---|
| Windows | Microsoft Windows (x86-64/Arm64) |
| macOS | macOS (x86-64/Apple Silicon) |
| Linux | Linux (x86-64/Arm64) |
GNU Project Debugger (GDB) Overview
The GNU Project Debugger (GDB) is a freely available debugger, distributed under the terms of the GNU Public license (GPL). It connects to an emulator via a TCP/IP connection. It can connect to every emulator for which a GDB server software is available. The latest Unix version of the GDB is freely available from the GNU committee under: http://www.gnu.org/software/gdb/download/
Availability: J-Link GDB Server comes with multi-platform support and is available for Windows, Linux and macOS.
Requirements: To use the J-Link GDB Server, you have to meet the following requirements:
- J-Link / J-Trace for Cortex-M
- Target hardware with supported CPU
Protocol Extensions:
- SWO support
GDB Server supports transfer of SWO data (terminal output, instrumentation trace, PC samples, etc.)
Supported Cores
J-Link GDB Server supports a variety of different cores and devices.
J-Link GDB Server
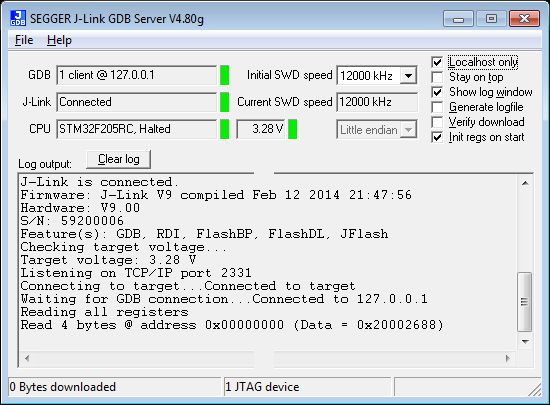
J-Link GDB Server (GUI Version): The J-Link GDB Server's user interface shows information about the debugging process and allows the user to configure some settings like target endianess, if memory reads should be cached in order to improve performance or if a logfile shall be generated.
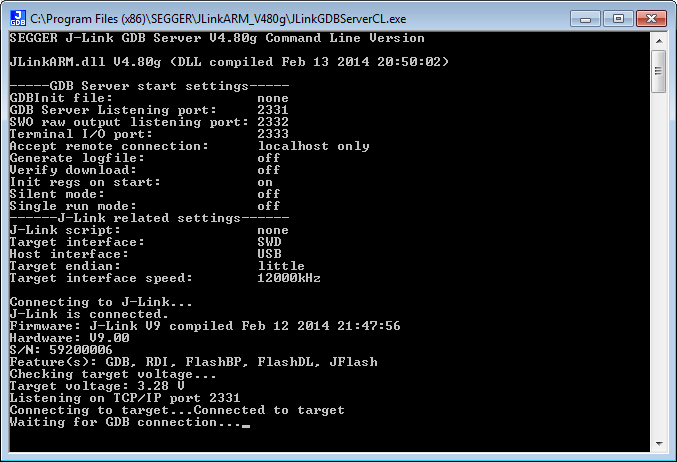
J-Link GDB Server (Command Line Version): The command line version of J-Link GDB Server is a special version of the J-Link GDB Server which does not provide any GUI interface and has been especially developed for J-Link Linux & MAC support.
It basically provides the same features as the GUI Version of J-Link GDB Server. The command line version of the J-Link GDB Server is also available for Windows and comes with the regular J-Link software and documentation package.
Setting up the J-Link GDB Server by Versions
Typically, most of the GDB and target setup is done from GDB via remote commands (monitor) in the .gdbinit file. The commands used in the .gdbinit file are performed before the download of the application into the target memory is performed. This allows the user to perform initialization steps which might be necessary to enable the access to the target memory.
The .gdbinit file also allows to use download into flash memory via J-Link and Unlimited Flash Breakpoints. Nevertheless, some options need to be setup when starting the GDB Server (Target endianess, device name for devices which need a special connect sequence) since this information is needed to guarantee a proper target connection
Protocol Extension
- SWO support
GDB Server supports transfer of SWO data (terminal output, instrumentation trace, PC samples, etc.)