J-Scope
Analyze and visualize application data in real time while the target is running
- Visualize multiple variables in real time
- Analyze data without halting the target
- No additional target hardware or pins required
Overview
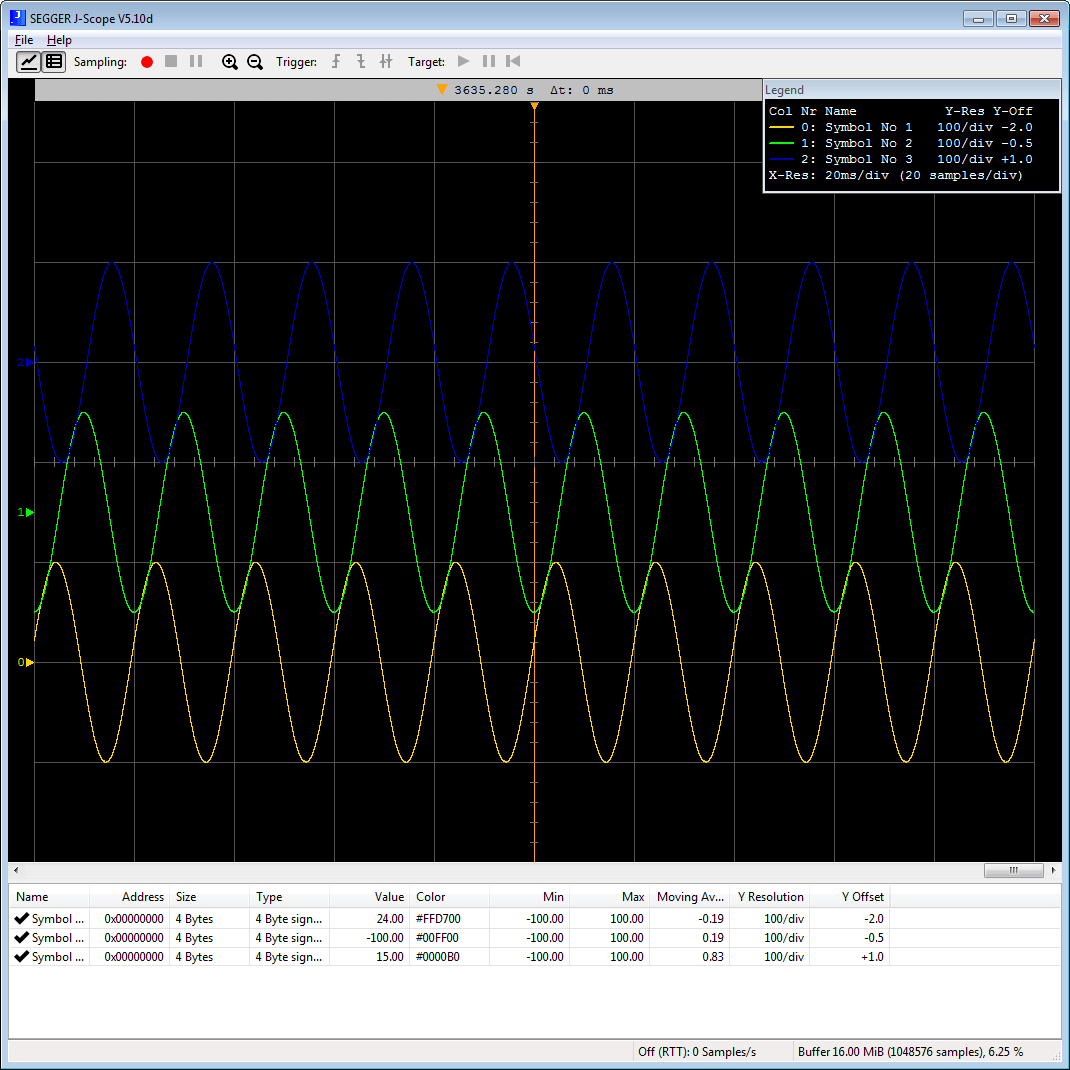
J-Scope uses the standard debug interface and does not require SWO or any additional target pins. It visualizes the values of multiple variables in an oscilloscope-like display while the application is running.
J-Scope reads the application's ELF file, making it easy to select the variables to be monitored. Simply connect the target microcontroller to J-Link, program the application, and start J-Scope. Configurations can be saved as project files for easy reuse and portability.
Each selected variable can be configured individually. Adjust the graph position and resolution, display variables as graphs or values in the watch panel, and zoom or scroll through the recorded data. Collected data can also be saved to a file for further analysis.
J-Scope can run in parallel with the debugging environment, adding real-time data visualization to the development workflow.
Getting started
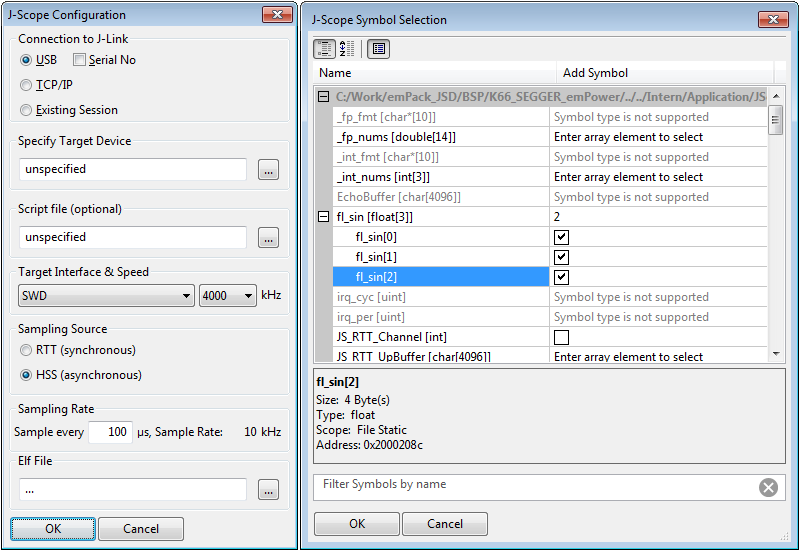
- Start J-Scope by double-clicking on the executable.
- In the configuration dialog, select your elf-file. For most targets, the configuration does not have to be specified. If there are any problems, select your target device and configure the interface accordingly.
- Click OK. The Symbol Selection Dialog opens.
- Select the symbols of your application, you want to watch and analyze. Click OK to start J-Scope.
Data sampling can be started via the record-button(red dot) in the toolbar. The configuration of elf-file and selected symbols can be saved into a J-Scope Project to be easily reused. J-Scope Projects can be opened via the menu or simply dropping them onto the executable.
For more information about how to use J-Scope, please refer to the SEGGER Knowledge Base.
Data acquisition methods
J-Scope provides two techniques of data acquisition:
- SEGGER High-Speed-Sampling (HSS).
- SEGGER Real-Time-Transfer (RTT). More info...
Both do not need extra hardware on the target like the provide the SWO pin on Cortex-M targets, everything is done via the normal debug signals used for debug communication when debugging a target. Both acquisition methods require the target to support background memory access, meaning J-Link can access the memory of the target system while the application is running and without the need to stop the CPU. For a list of targets CPUs which support background memory access, please see below on this page. This allows non-intrusive analysis of the data without breaking any real-time behaviour of the target application. For best results and experience, a J-Link Pro / ULTRA+ is recommended.
Data acquisition via RTT
When using this technique, the target application performs the sampling of the data and stores the results in a RTT buffer, residing in the target's memory. J-Link periodically reads data from the RTT buffer and transfers it to the J-Scope application. In the following, the pro and contra of this technique are explained.
Pros:
- Allows much higher data throughput than HSS. Up to 2 MB/s can be achieved. Even with a small buffer of 512 bytes on the target, up to 1 MB/s can be achieved
- Data acquisition is synchronous to the target application execution as the application decides when and what data is sampled
- Location of variables does not need to be known to J-Scope. Location of RTT buffer is automatically detected by J-Scope on connect.
- Timestamps etc. can be added to the data samples, allowing to set acquired data in a context to the target application execution state
- No additional hardware (like an extra pin for SWO on Cortex-M) are needed
Cons:
- Requires instrumentation of the target application to provide a buffer and store sampling data to it where required
- Small RTT buffer is required
Data acquisition via HSS
When using this technique, J-Link periodically reads data from specified addresses on the target in the background, in fixed intervals, and transfers the data to the J-Scope application. In the following, the pro and contra of this technique are explained.
Pros:
- Does not require any instrumentation of the target application. J-Scope can just attach to an existing application and start sampling
- No additional hardware (like an extra pin for SWO on Cortex-M) are needed
Cons:
- Relatively low sampling frequency and max. data throughput compared to the RTT method.
- Max. sampling frequency heavily depends on the J-Link model and number of variables being sampled. For a list of max. sampling frequency with 1 variable watched, please refer to the tab "Supported Targets"
- Data acquisition happens in fixed intervalls and is asynchronous to the application execution making it not really possible to sync acquired data to the application execution state
Supported targets
J-Scope and HSS can be used with any target, which is supported by J-Link and allows background memory access while the target is running.
| Core | HSS |
|---|---|
| ARM7, ARM9, ARM11 | |
| Cortex-M0 | |
| Cortex-M1 | |
| Cortex-M3 | |
| Cortex-M4 | |
| Cortex-M7 | |
| Cortex-M23 | |
| Cortex-M33 | |
| Cortex-M52 | |
| Cortex-M55 | |
| Cortex-M85 | |
| Cortex-A, Cortex-R | |
| RX100 | |
| RX200 | |
| RX600 | |
| RX700 | |
| PIC32 |
Model comparison
| J-Link Model | Max. no. of variables | Max. sampling frequency |
|---|---|---|
| J-Link Pro (V4 or later) | 100 | Unlimited1 |
| J-Link Ultra (V4 or later) | 100 | Unlimited1 |
| Other models | 10 | 1 kHz2 |
1 Only limited by the bandwidth of the debug interface. Typical sampling frequency of one variable: > 10 kHz.
2Max. sampling frequency is guaranteed for sampling one variable and for appropriate target interface speeds being selected (min. 1 MHz).
Sampling more than one variable in parallel, may lead to a smaller max. sampling frequency. When this threshold of sampling frequency decrease is hit, depends on different factors (Number of variables to be sampled in parallel, size of each variable, selected target interface speed, ...)
| Supported OS | |
|---|---|
| Windows | Microsoft Windows (x86-64/Arm64) |
| macOS | macOS (x86-64/Apple Silicon) |
| Linux | Linux (x86-64/Arm64) |
Licensing
J-Scope comes as part of the J-Link Software and Documentation Package. The software package is free for any J-Link or J-Trace device and can be downloaded here: