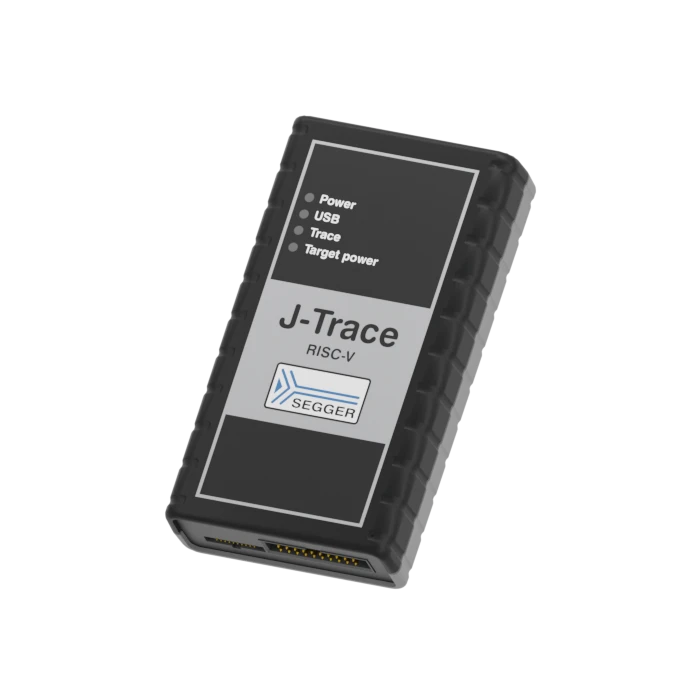
J-Trace Pro RISC-V
The RISC-V trace probe
- Combines J-Link debugging with advanced trace analysis and profiling
- Unlimited instruction trace recording to capture rare and hard-to-reproduce bugs
- Live Code Coverage and Live Code Profiling with high-speed streaming via USB 3.0
Key features
Real-time instruction trace
Captures every executed instruction non-intrusively in real time, which enables developers to pinpoint hard-to-find issues and thoroughly understand program flow.
Live code coverage and profiling
Tracks executed code and measures performance in real time, supporting optimization of applications and revealing untested or inefficient sections.
Same licenses and features as J‑Trace Pro
Comes with the full set of J-Link Pro licenses and capabilities, ensuring seamless debugging and compatibility across a wide range of microcontrollers and development environments.
Device support
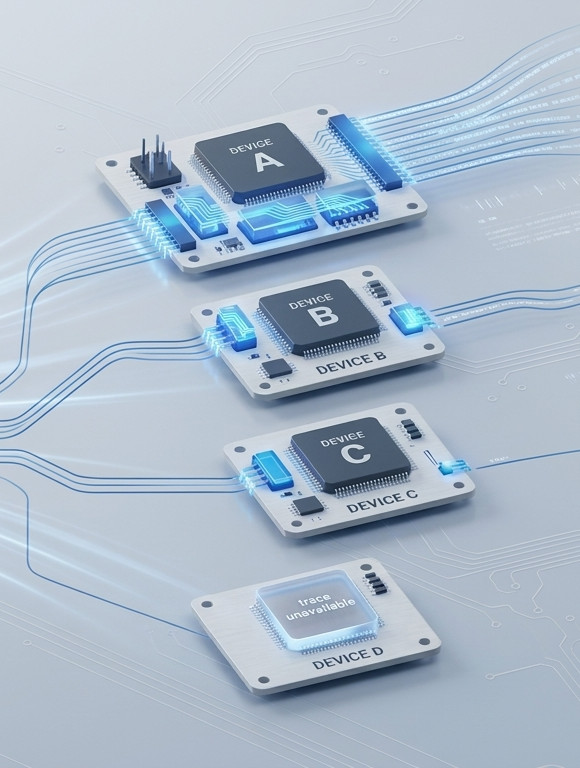
Any device supported by J-Link can also be used with J-Trace. The available trace functionality depends on the trace components implemented by the target device. The Tested Devices list contains devices that have been explicitly validated for trace functionality using J-Trace streaming trace probes. Ready-to-use reference projects are available for many of these devices, enabling trace out of the box.
Devices not included in this list can also be traced, provided they implement the required trace components for Arm or RISC-V.
Supported devices
J-Trace probes provide J-Link debugging capabilities and features for selected devices.
Device not listed? Please don’t hesitate to contact us.
Use cases



J-Trace technology
Streaming trace
J-Trace probes features continuous streaming trace, which enables non-intrusive live trace data analysis and instruction tracing on the host computer while the target system is running.
Live Code Profiling
Code profiling shows which instructions are executed and how often. It helps identify runtime hotspots and optimization potential by measuring the execution time and frequency of functions, blocks, and instructions. The results highlight where processing time is spent and can be exported using tools such as the Ozone debugger for documentation and further analysis.
Live Code Coverage
Live Code Coverage provides precise insight into how much of a source line, block, function, or file is executed on the target. This makes it possible to identify code that is not covered by tests, including unreachable sections, and enables efficient code improvements or the creation of targeted test suites for uncovered blocks.
Unlimited Breakpoints
Set as many breakpoints as you need in internal or external flash. Debug thoroughly, even when hardware breakpoints run out.
Tool set
J-Trace uses the same proven software ecosystem as J-Link. All tools and extensions available for J-Link are therefore fully compatible with J-Trace, ensuring a consistent workflow across debug and trace setups.

Device Provisioner
The Device Provisioner helps to provision microcontrollers for debug, trace or production access, including locking the device afterwards. It simplifies the automation of configuring security features on target devices.
Ozone
It integrates seamlessly with SEGGER’s Ozone debugger, providing a powerful environment for performance analysis, instruction tracing, and code optimization.
SystemView
SystemView is an embedded software-tracing tool designed to analyze and profile the behavior of real-time systems. It offers deep insights into runtime behavior, surpassing the capabilities of traditional debuggers.
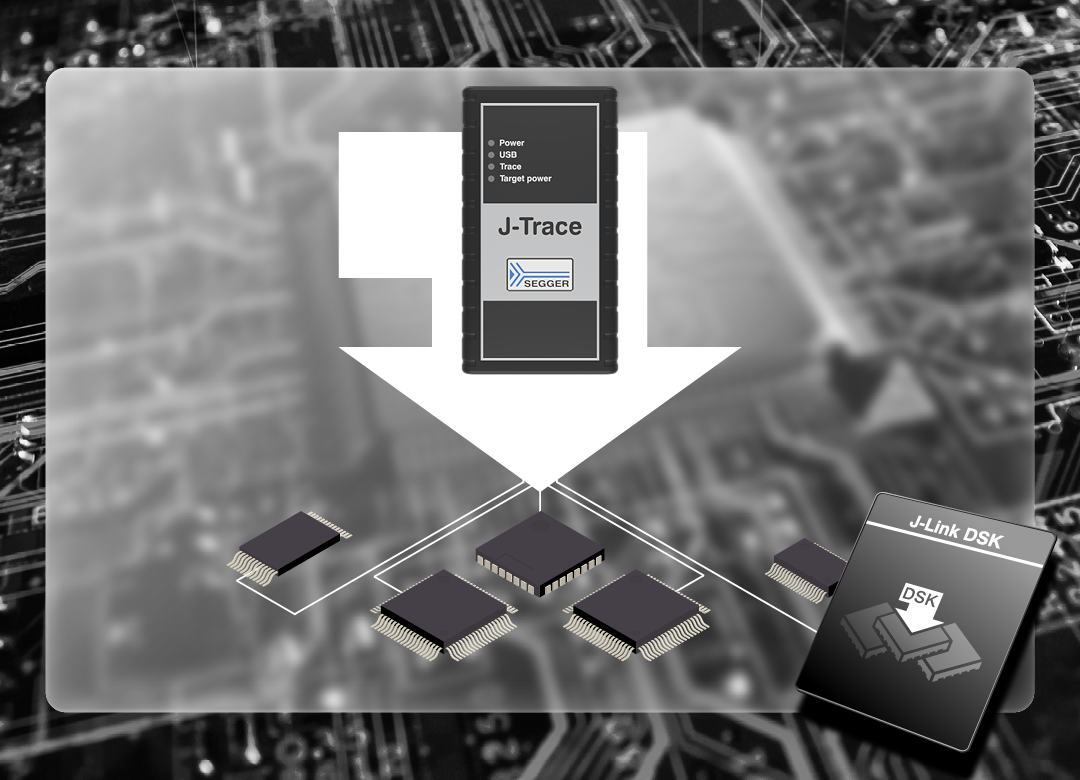
Device Support Kit (DSK)
The J-Link DSK can also be used with J-Trace and allows silicon vendors and users to add debug and flash programming support for new devices for use with J-Link and J-Trace. A new device typically requires a flash loader and, in some cases, a script defining special connect and reset sequences.
The DSK includes the SEGGER flash loader as well as a collection of example script files for devices that require special handling.
Software Development Kit (SDK)
The J-Link SDK enables the integration of J-Link and J-Trace support into custom applications. It is used in professional IDEs, such as SEGGER Embedded Studio, and debug software such as Ozone, to enable direct debugging with J-Link and J-Trace. The SDK also provides dedicated trace features for capturing and analyzing trace data with J-Trace.
Available for Windows, Linux, and macOS, the SDK can be used with nearly any programming language or development environment.
Software
All software is included free of charge.
For every J-Trace, the J-Link Software and Documentation Package is available here:
Buyers Guide
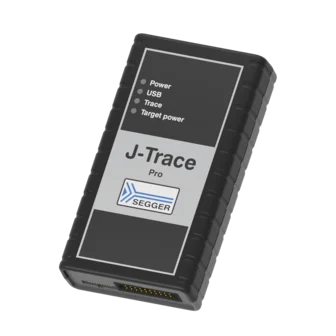
J-Trace Pro
Cortex A/R
Cortex-M
RISC-V
Trace reference boards
Real Time Transfer (RTT)
Download speed
up to 4.0 MByte/sec
Target interface speed
up to 50 MHz
Trace clock speed up to 200 MHz
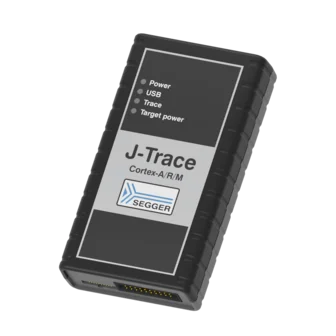
J-Trace Pro Cortex
Cortex A/R
Cortex-M
RISC-V
Trace reference boards
Real Time Transfer (RTT)
Download speed
up to 4.0 MByte/sec
Target interface speed
up to 50 MHz
Trace clock speed up to 200 MHz
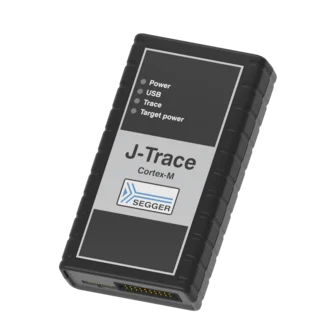
J-Trace Pro Cortex-M
Cortex A/R
Cortex-M
RISC-V
Trace reference boards
Real Time Transfer (RTT)
Download speed
up to 4.0 MByte/sec
Target interface speed
up to 50 MHz
Trace clock speed up to 200 MHz
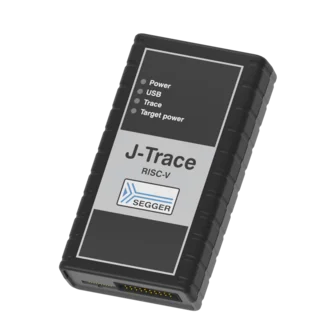
J-Trace Pro RISC-V
Cortex A/R
Cortex-M
RISC-V
Trace reference boards
Real Time Transfer (RTT)
Download speed
up to 4.0 MByte/sec
Target interface speed
up to 50 MHz
Trace clock speed up to 200 MHz
Customer support
Every J-Trace comes with one year of Initial Coverage & Warranty, providing hardware warranty and support. At the time of purchase, Coverage & Warranty can be extended to a total period of 3 or 5 years.
To extend coverage beyond the inital period, Extended Coverage can be purchased.
Please note: Support is available for registered products only.
Organizations with a larger number of SEGGER hardware products may benefit from Company Support. This allows engineers to receive technical assistance regardless of the coverage status of their individual devices.
Media gallery
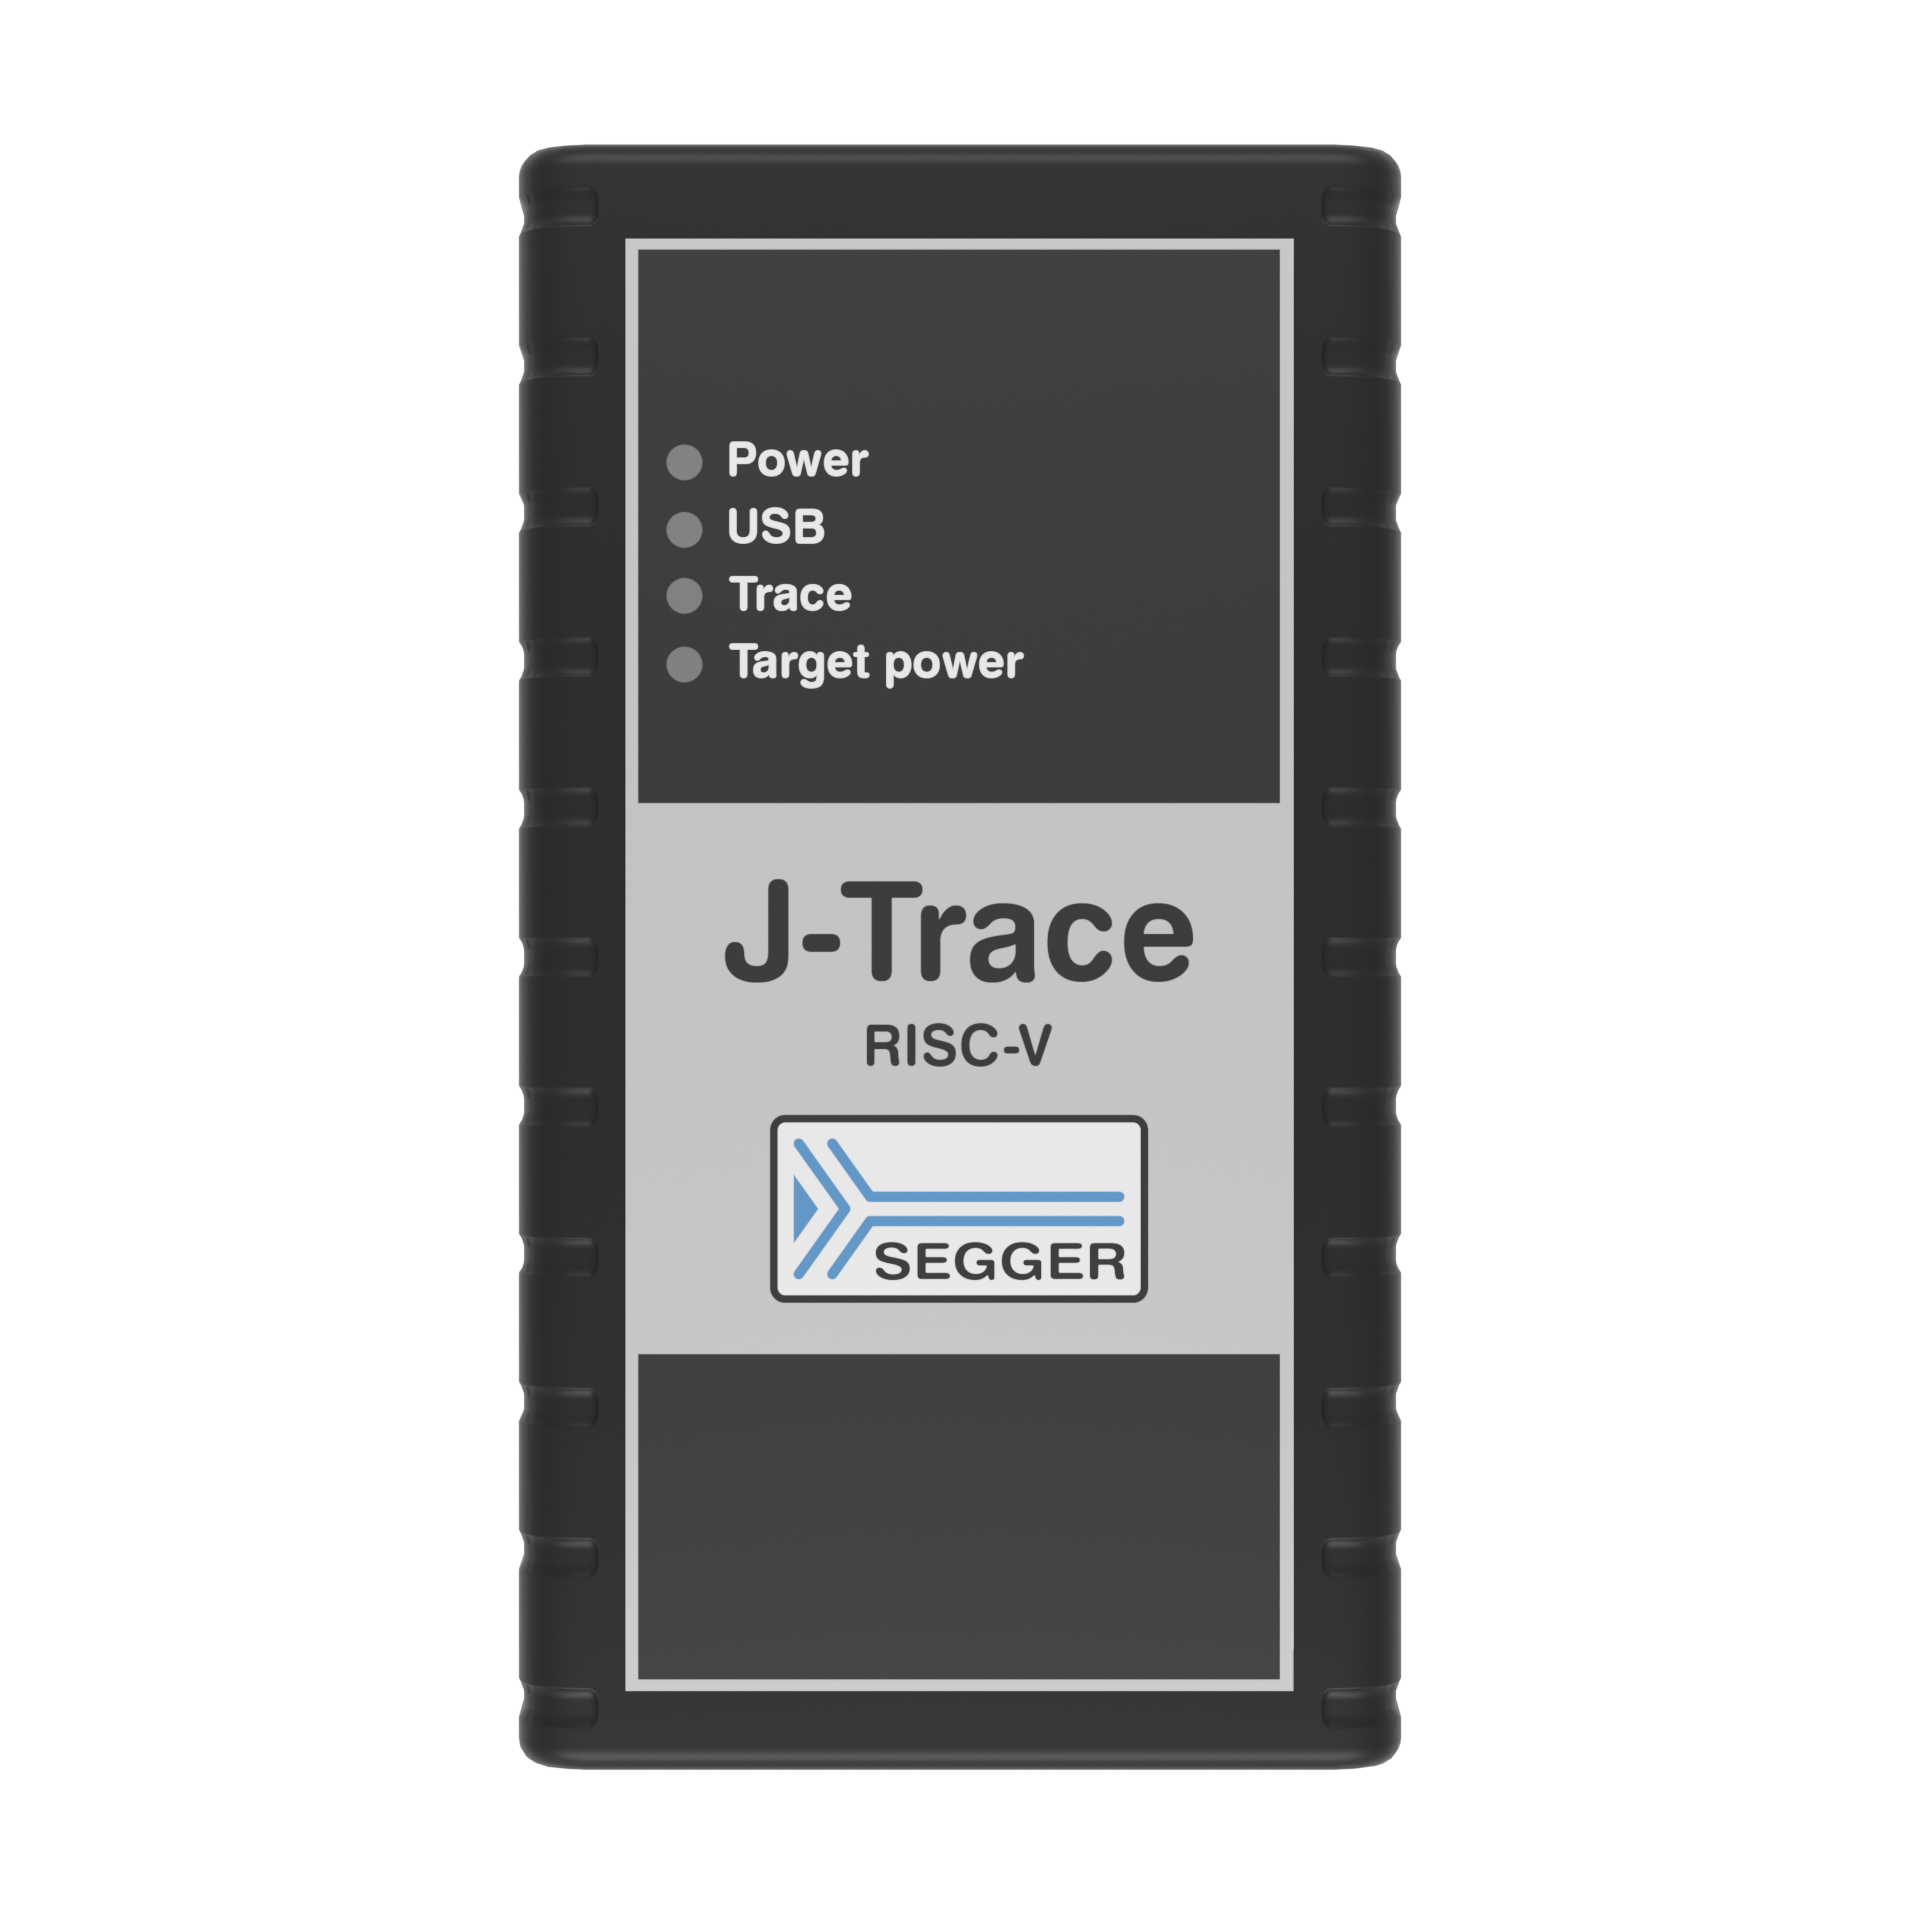
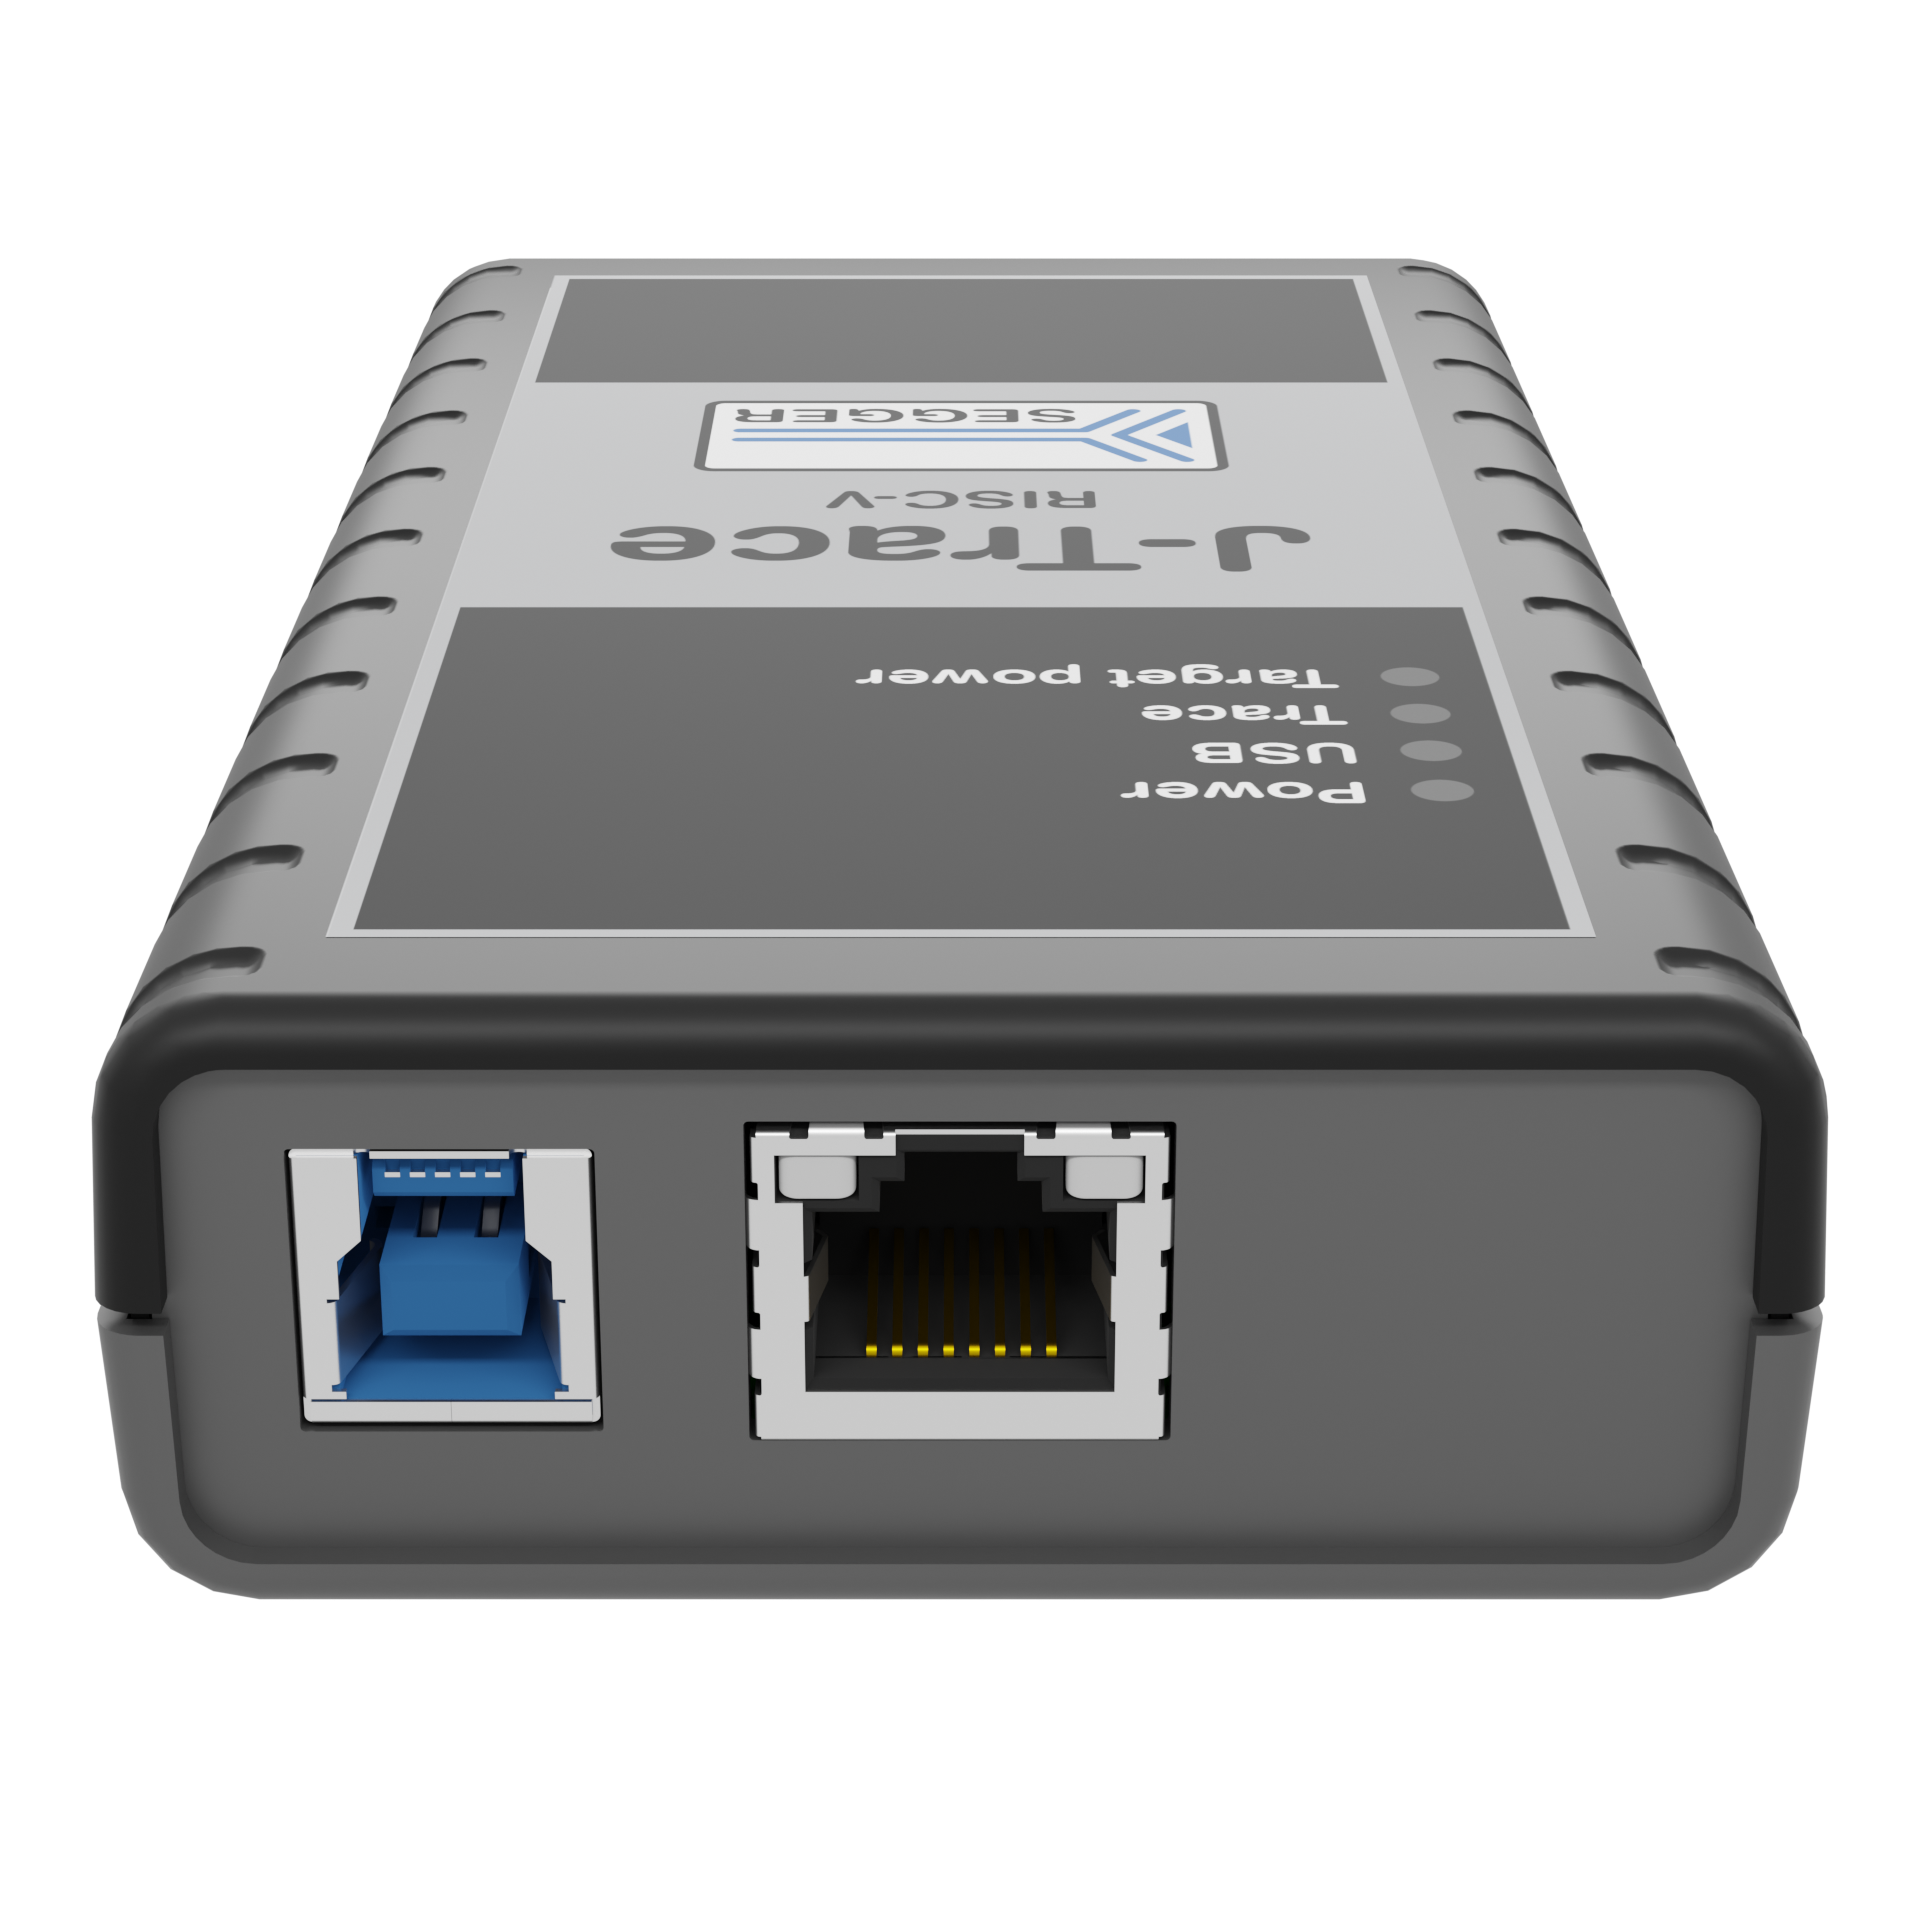
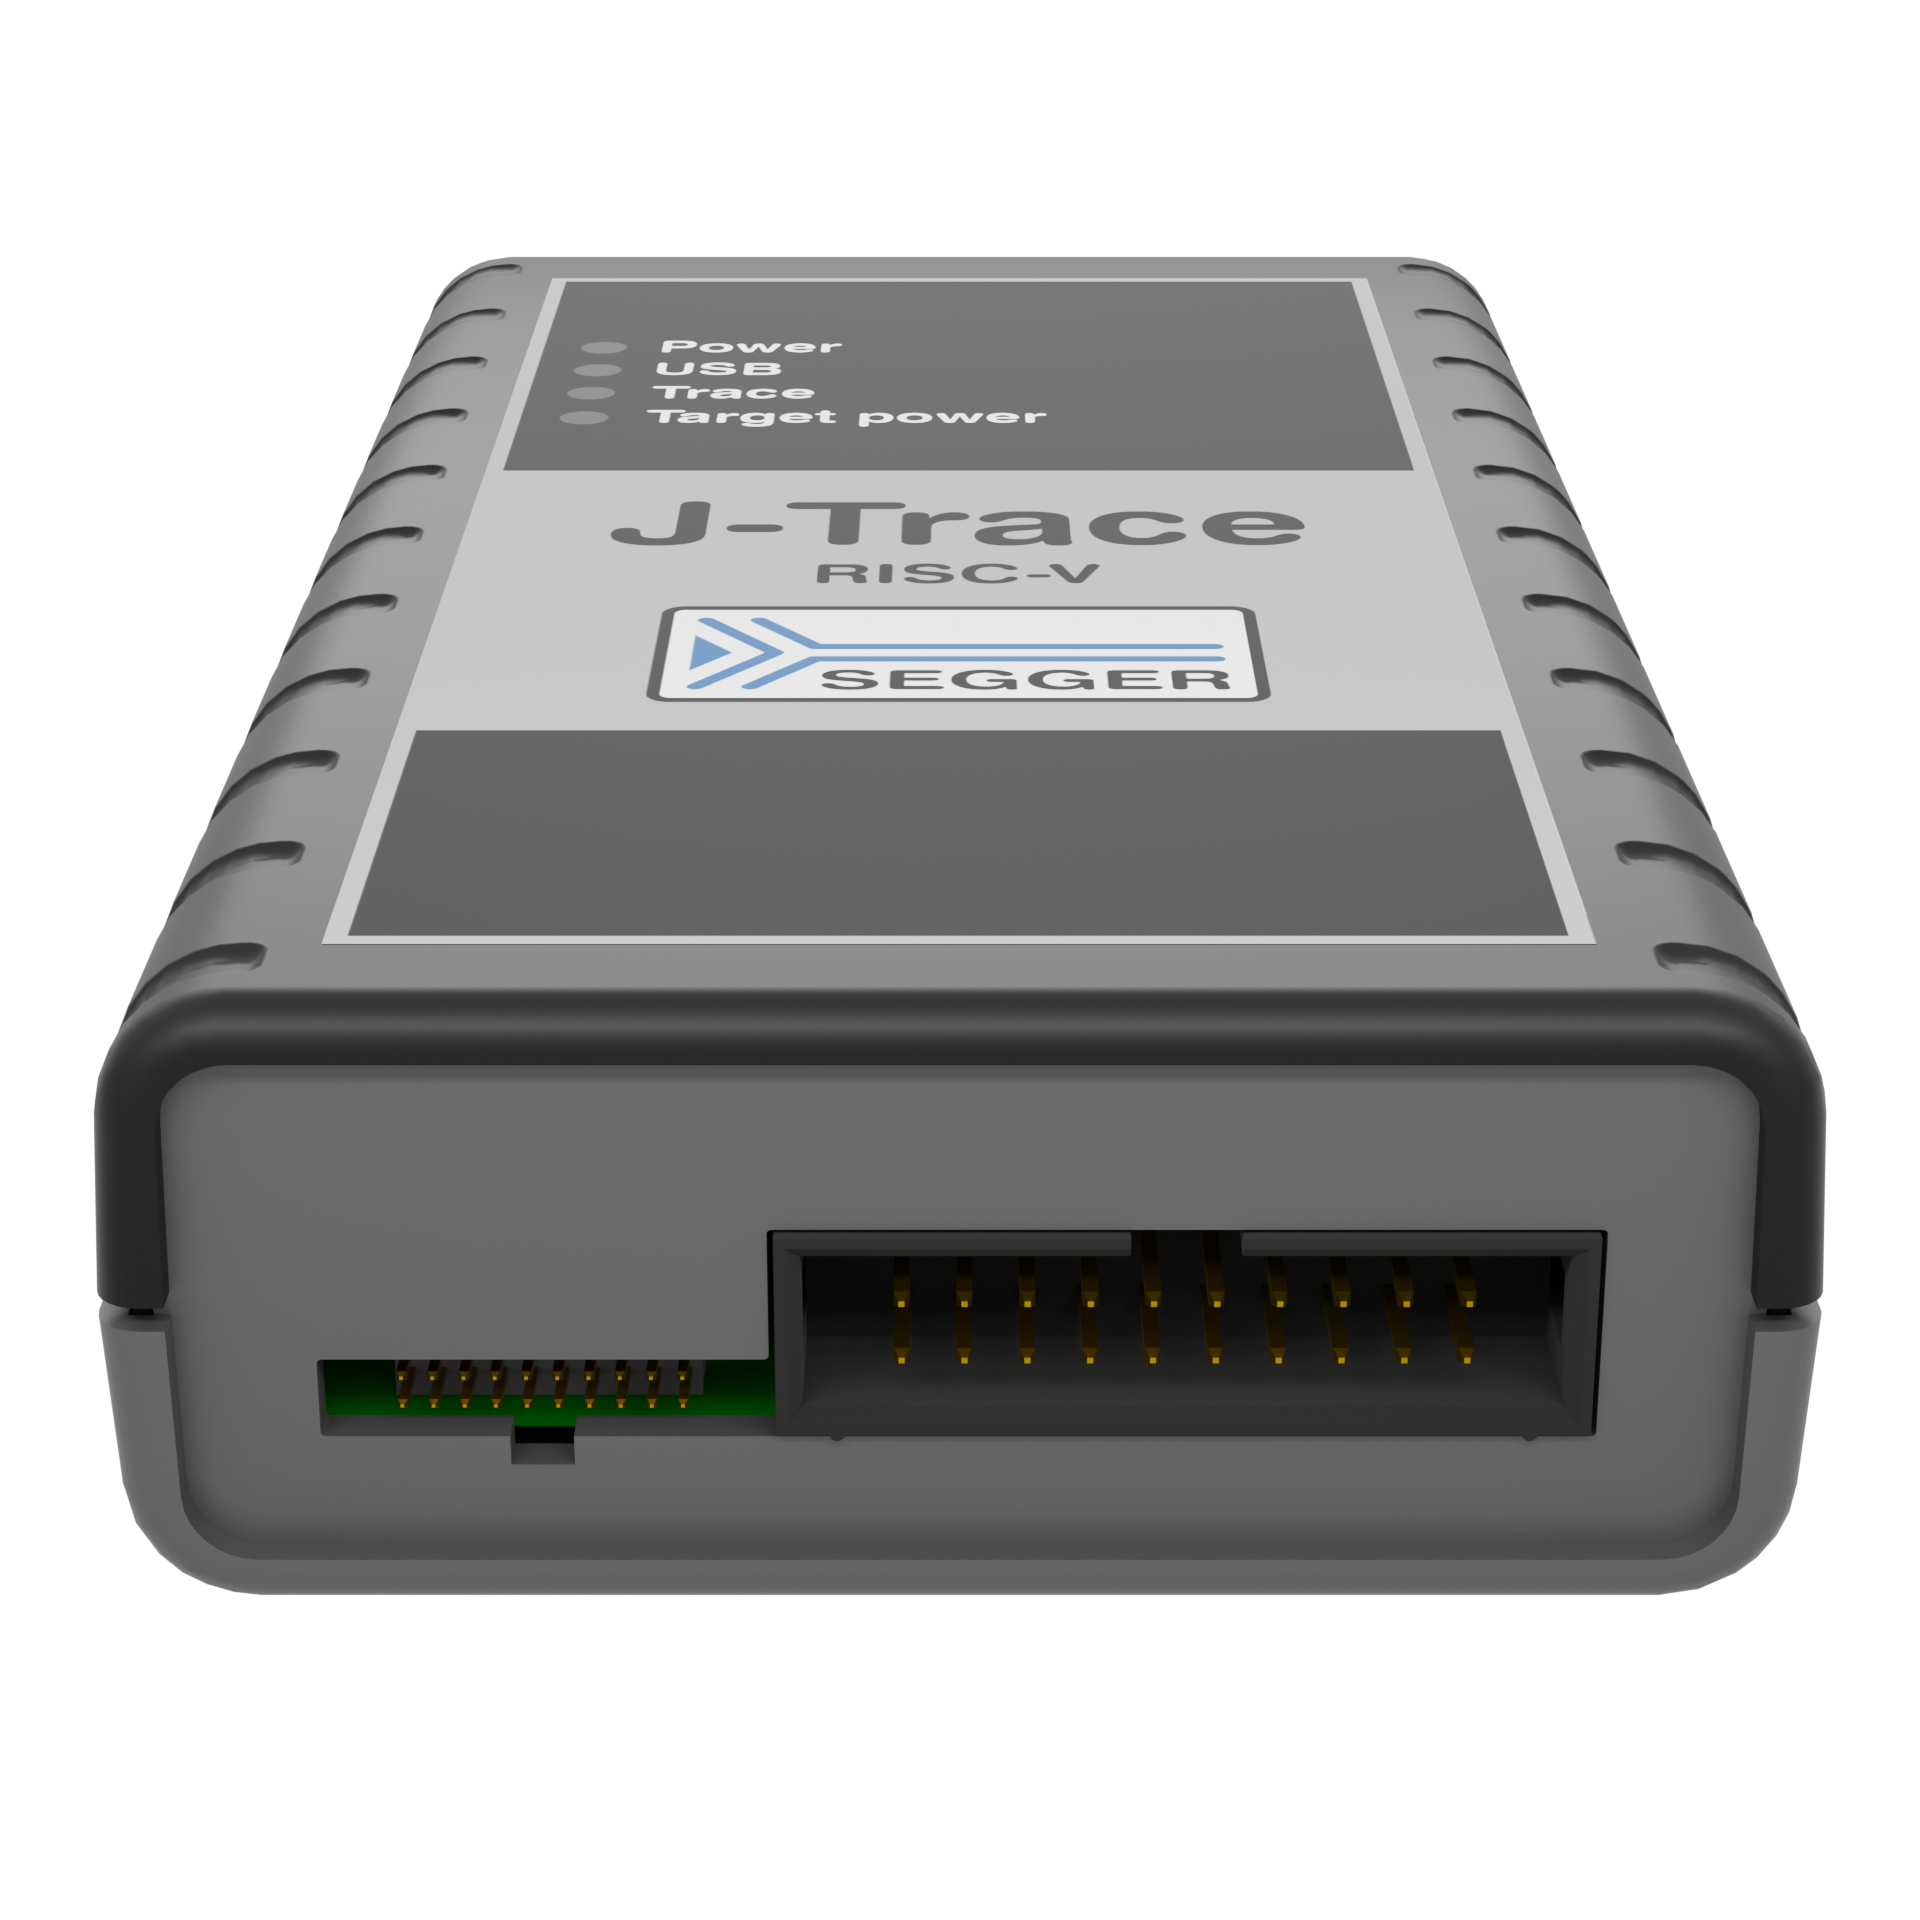
Product images
Videos
Technical specifications
| Specification | Value |
|---|---|
| Supported OS | Microsoft Windows (x86-64, Arm64), Linux (x86-64, Arm64), macOS (x86-64, Apple Silicon) |
| Electromagnetic compatibility (EMC) | EN 55022, EN 55024 |
| Operating temperature | +5°C ... +60°C |
| Storage temperature | -20°C ... +65 °C |
| Relative humidity (non-condensing) | Max. 90% rH |
| Mechanical | |
| Size (without cables) | 123mm x 68mm x 30mm |
| Weight (without cables) | (without cables) 120g |
| Available interfaces | |
| Ethernet interface | Gigabit |
| USB interface | USB 3.0, SuperSpeed |
| Target interface | JTAG/SWD 20-pin (14-pin adapter available) JTAG/SWD + Trace 19-pin |
| JTAG/SWD interface, electrical | |
| Power supply | USB-powered (max. 400mA) |
| Target interface voltage (VIF) | 1.2V ... 5V |
| LOW level input voltage (VIL) | VIL <= 40% of VIF |
| HIGH level input voltage (VIH) | VIH >= 60% of VIF |
| Reset type | Open drain with 100 Ohms series resistor. Can be pulled low or tristated |
| JTAG/SWD interface, timing | |
| Data input rise time (Trdi) | Max. 20ns |
| Data input fall time (Tfdi) | Max. 20ns |
| Data output rise time (Trdo) | Max. 10ns |
| Data output fall time (Tfdo) | Max. 10ns |
| Clock rise time (Trc) | Max. 10ns |
| Clock fall time (Tfc) | Max. 10ns |
| Trace interface, electrical | |
| Power supply | USB-powered (max. 400mA) |
| Target interface voltage (VIF) | 1.2V ... 5V |
| Voltage interface low pulse (VIL) | Max. 40% of VIF |
| Voltage interface high pulse (VIH) | Min. 60% of VIF |
| Capacitive load | 3 pF J-Trace + 8 pF cable (typical) |
| Trace interface | |
| Max. trace clock frequency | 200 MHz |
Package content
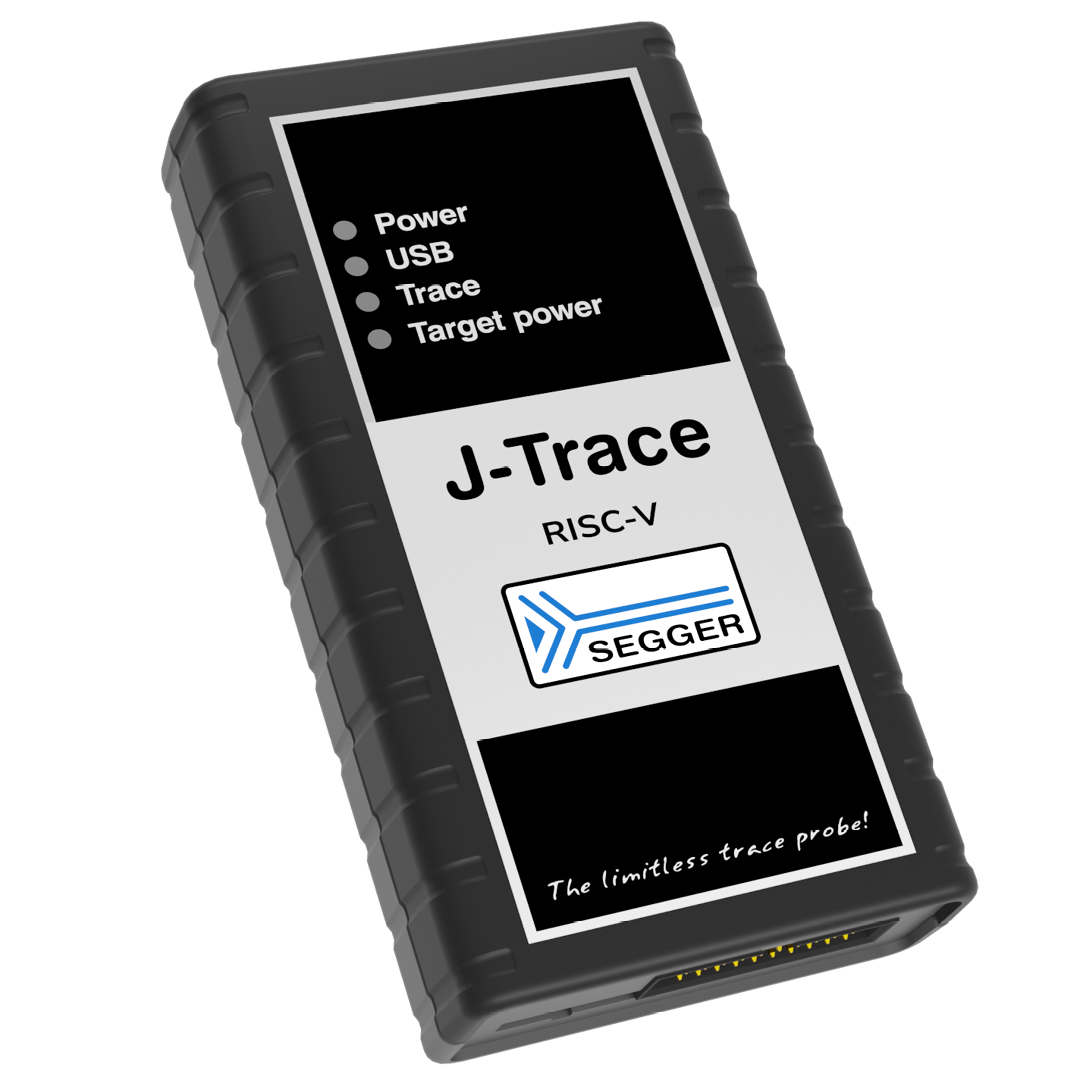
J-Trace Pro RISC-V
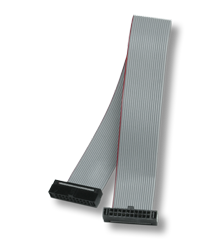
20-pin, 0.05" target ribbon cable

20-pin, 0.1" target ribbon cable
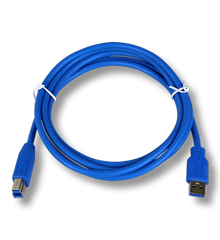
USB 3.0 cable
FAQ
What is the advantage of using the J-Trace Pro over other trace probes?
One of the biggest advantages of the J-Trace Pro is its streaming trace capability. Streaming trace allows for continuous live trace analyses, enabling debugging for even the most complex problems.
Can I use the J-Trace Pro as a debug probe?
Yes. The J-Trace Pro includes all capabilities of the J-Link debug probes and comes with all licenses, such as for Unlimited Flash Breakpoints. It can be used with the J-Link software as well as with any tool that supports the J-Link.
Can the J-Trace Pro be used with any IDE?
Yes. The J-Trace Pro can be used with all common IDEs, just like any J-Link debug probe.
Can any IDE be used for tracing as well?
Unfortunately most IDE vendors do not offer trace analysis features. If they do, it is only to a limited degree.
What can I use for tracing and analysis?
We recommend using the graphical standalone debugger Ozone. It supports all J-Trace Pro capabilities and compliments them with its advanced analysis features. Ozone can be used independent of a compiler, with the output of any IDE or toolchain. It can also be used completely free of charge with a J-Trace Pro, even for commercial use.
What do I need in order to trace with a J-Trace Pro?
Just connect the target device and start debugging. J-Trace Pro is designed to simply get working. It can be up and running in less than 10 minutes. A guide can be found here.
Where can I find trace-related troubleshooting information?
Tracing is a very hardware-dependent debug technique, and some target hardware modifications or designs can cause issues when trying to set up the trace debug interface. To give our customers an easy-to-use troubleshooting platform with the most asked questions answered, we have created the following setup page: Setting up trace.
Any more questions? Please contact us.
Are there any trace example projects that I can use for orientation?
Yes, every J-Trace Pro gets shipped with a Cortex-M Trace Reference Board. An example project is part of the J-Trace tutorial. We also created a list of tested devices that each come with an example project that runs out-of-the-box with a J-Trace Pro and Ozone. The list is available here and is updated regularly.
My device is not on the tested devices list, what can I do to get an example project for it?
The trace-capable MCU market is growing, and it is becoming harder to keep track of all devices. If we don't happen to have a trace example for your particular device, please feel free to contact us.
The requirements for adding a new example project are:
- Must be supported by J-Link software: overview of supported CPUs and devices
- The target hardware must be publicly available and an evaluation board.
- Trace pins must be physically connected to the trace debug interface.
What is the maximum voltage that can be handled by the galvanic isolation of the Ethernet?
The Ethernet data lines are isolated as required per IEEE 802.3 (test voltage 1500 Vrms for one minute). Note that this is NOT valid for the Ethernet shield that has a direct electrical contact to the USB shield and a resistive and capacitive coupling to probe GND. For an effective isolation, you need to use an unshielded twisted pair Ethernet cable.
Latest news
Related content
Get in touch with us
Have questions or need assistance? Our Embedded Experts are here to help!
Reach out to us for:
- Licensing quotes
- Technical inquiries
- Project support